Updated November 12, 2026, with newer counts (Rhode Island and two Virginia counties added) and corrected 2022 totals for 10 counties. The medians moved slightly.
First published November 9, 2026, from counts read through November 6, 2026: across 1,442 counties in 17 states, the median county moved 6.1 points toward Democrats, and turnout in the median county ran 1.7 points of registered voters above 2022.
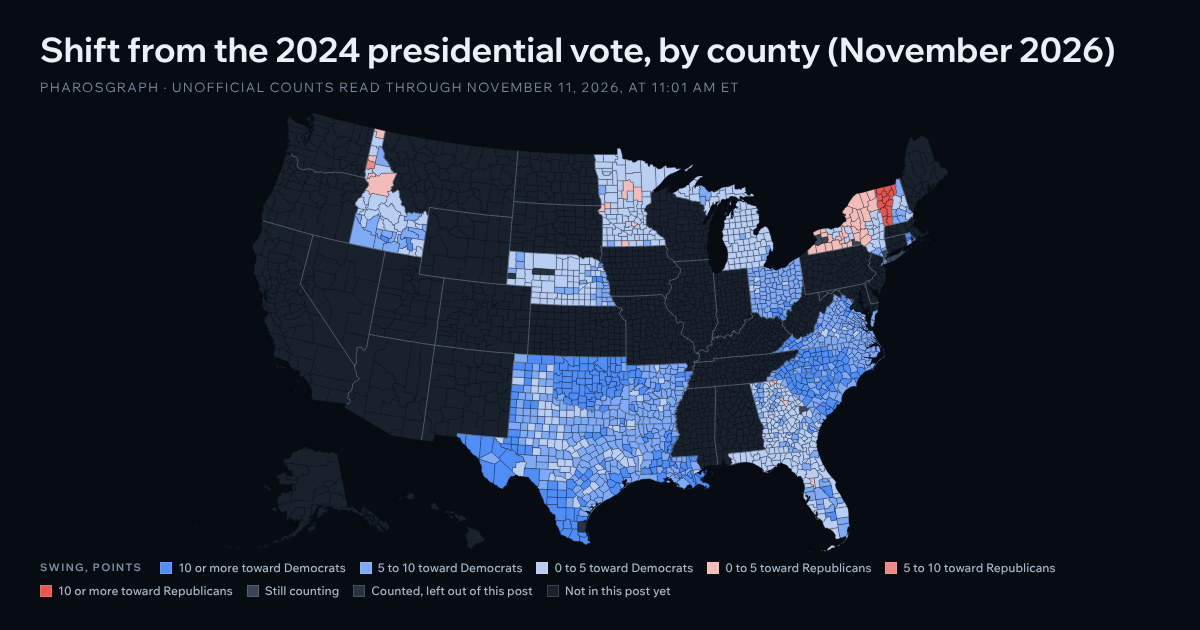
In the 2026 midterms, the median county across 18 states moved 6.2 points toward Democrats from the 2024 presidential vote, PharosGraph found. That’s from unofficial counts in 1,449 counties, read through November 11, 2026, at 11:01 AM ET. These are the 18 states with counted counties so far; other states join this page as their counts finish. The median county is the middle one when all 1,449 are ranked by how far they moved: half moved more and half moved less.
In the six states where we can compare with the 2022 midterm (Florida, Georgia, Michigan, Nebraska, New York and North Carolina), turnout in the median county ran 1.8 points of registered voters above 2022.
Before the vote, PharosGraph’s estimates pointed to a Democratic shift in the competitive Senate and governor races: see how they compared with the results.
Every figure in this post is unofficial and will change as states finish counting and certify their results.
See every county’s shift from 2024 on the map: https://maps.pharosgraph.com/us-county-swing-2026/
Of the 1,449 counties, 1,390 moved toward Democrats. The largest shifts in the median county came in Oklahoma’s governor’s race (13.1 points), Rhode Island’s Senate race (11.0) and South Carolina’s Senate race (10.5). Vermont’s governor’s race moved the other way, 19.0 points toward Republicans in the median county. New York’s count is still preliminary: its counted counties hold 73% of the state’s vote, and Suffolk, Nassau, Westchester, Erie and two smaller counties are still out. So far, its median counted county is nearly unchanged from 2024, and we’ll update New York below this figure when those counties are in. Larger counties moved further than small ones on average, so across all the votes cast in these counties together, the Democratic share of the two-party vote rose 7.4 points.
Where the 2026 swing happened: which counties swung most
Swing and turnout by state, 2026 midterms
| State | Race used | Counties in this post | Share of the state’s vote in counted counties | Median swing from 2024 (points) | Range (points) | Median turnout change since 2024 (points of registered voters) | Median turnout change since 2022 (points of registered voters) |
|---|---|---|---|---|---|---|---|
| Arkansas | Senate | 75 of 75 | 100% | +7.5 | +3.8 to +15.4 | −20.4 | no 2022 baseline |
| Florida | Senate | 67 of 67 | 100% | +3.5 | −2.9 to +13.5 | −19.7 | +1.2 |
| Georgia | Governor | 158 of 159 | 100% | +3.5 | −2.5 to +10.7 | −18.2 | −0.6 |
| Idaho | Governor | 44 of 44 | 100% | +3.6 | −6.1 to +10.4 | −24.0 | no 2022 baseline |
| Louisiana | Senate | 64 of 64 | 100% | +9.4 | +4.2 to +15.0 | −21.0 | no 2022 baseline |
| Michigan | Senate | 83 of 83 | 100% | +3.2 | +0.7 to +6.8 | −13.5 | +2.5 |
| Minnesota | Senate | 87 of 87 | 100% | +1.6 | −0.9 to +7.2 | −15.4 | no 2022 baseline |
| Nebraska | Governor | 89 of 93 | 100% | +3.5 | +0.2 to +10.8 | −17.4 | +4.8 |
| New Hampshire | Senate | 10 of 10 | 100% | +5.8 | +3.9 to +7.0 | −17.7 | no 2022 baseline |
| New York | Governor | 56 of 62 | 73% | −0.1 (preliminary) | −4.5 to +10.6 | −17.9 | −0.2 |
| North Carolina | Senate | 100 of 100 | 100% | +10.3 | +5.7 to +14.1 | −22.8 | +3.7 |
| Ohio | Senate | 88 of 88 | 100% | +7.8 | +3.6 to +10.7 | −20.1 | no 2022 baseline |
| Oklahoma | Governor | 77 of 77 | 100% | +13.1 | +6.3 to +17.3 | −26.7 | no 2022 baseline |
| Rhode Island | Senate | 5 of 5 | 100% | +11.0 | +9.3 to +14.0 | −20.5 | no 2022 baseline |
| South Carolina | Senate | 46 of 46 | 100% | +10.5 | +5.7 to +14.6 | −16.0 | no 2022 baseline |
| Texas | Governor | 253 of 254 | 100% | +7.0 | +0.9 to +32.6 | −14.3 | no 2022 baseline |
| Vermont | Governor | 14 of 14 | 100% | −19.0 | −25.4 to −11.9 | −14.8 | no 2022 baseline |
| Virginia | Senate | 133 of 133 | 100% | +7.6 | +3.4 to +15.7 | −16.5 | no 2022 baseline |
Swing is the 2026 Democratic share of the two-party vote minus the 2024 presidential Democratic share in the same county. Positive is toward Democrats. Each state’s race is its 2026 statewide race with the most votes.
The counties that moved most, 2026 midterms
| County | State | Race used | Swing from 2024 (points) | 2024 presidential Democratic two-party share |
|---|---|---|---|---|
| Starr | Texas | Governor | +32.6 | 42.0% |
| Zapata | Texas | Governor | +27.2 | 38.7% |
| Maverick | Texas | Governor | +27.1 | 40.7% |
| Hidalgo | Texas | Governor | +22.7 | 48.6% |
| Webb | Texas | Governor | +21.2 | 48.9% |
| Cameron | Texas | Governor | +20.4 | 47.1% |
| Duval | Texas | Governor | +19.2 | 45.1% |
| Jim Hogg | Texas | Governor | +18.5 | 54.1% |
| Canadian | Oklahoma | Governor | +17.3 | 29.4% |
| Caddo | Oklahoma | Governor | +17.2 | 26.0% |
| Caledonia | Vermont | Governor | −16.7 | 56.4% |
| Orange | Vermont | Governor | −17.0 | 60.5% |
| Rutland | Vermont | Governor | −18.6 | 52.7% |
| Windsor | Vermont | Governor | −19.4 | 68.3% |
| Addison | Vermont | Governor | −19.9 | 68.5% |
| Franklin | Vermont | Governor | −20.0 | 51.5% |
| Washington | Vermont | Governor | −21.9 | 72.4% |
| Chittenden | Vermont | Governor | −24.3 | 77.6% |
| Lamoille | Vermont | Governor | −24.3 | 68.5% |
| Grand Isle | Vermont | Governor | −25.4 | 60.8% |
The first ten moved most toward Democrats; the last ten moved least toward Democrats, or toward Republicans. Each county’s swing compares its state’s top 2026 race with the 2024 presidential vote, so a strong candidate in one state’s race shows up as swing across that state’s counties.
Which states are counted
This post covers Arkansas, Florida, Georgia, Idaho, Louisiana, Michigan, Minnesota, Nebraska, New Hampshire, New York, North Carolina, Ohio, Oklahoma, Rhode Island, South Carolina, Texas, Vermont and Virginia. A county is in once its count is complete: at least 95% of precincts reporting where that measures completeness, no mail ballots outstanding, and no change between two reads an hour apart.
In those states, seven counties are still being counted: Georgia (Burke); New York (Broome, Erie, Nassau, Suffolk, Westchester and Wyoming).
Five fully counted counties are left out: Banner, Grant, Hooker and Thomas in Nebraska, because our voter profile doesn’t cover them well enough, and Kenedy in Texas, because the Census survey data we use for every county isn’t available for it.
Arizona, Pennsylvania, Maine and other states aren’t in yet. We’ll add them to this page as their counts finish and keep the November 11, 2026, figures visible.
The largest counties, 2026 midterms
| County | State | Race used | Votes cast in 2026 | 2026 Democratic two-party share | 2024 presidential Democratic two-party share | Swing (points) | Turnout change since 2024 (points) |
|---|---|---|---|---|---|---|---|
| Harris | Texas | Governor | 1,383,460 | 64.5% | 52.8% | +11.7 | −7.0 |
| Miami-Dade | Florida | Senate | 784,423 | 53.6% | 44.2% | +9.4 | −20.1 |
| Dallas | Texas | Governor | 784,374 | 70.0% | 61.3% | +8.6 | −4.9 |
| Wayne | Michigan | Senate | 738,765 | 71.9% | 65.0% | +6.8 | −8.7 |
| Tarrant | Texas | Governor | 729,430 | 57.2% | 47.4% | +9.8 | −7.9 |
| Oakland | Michigan | Senate | 671,858 | 57.3% | 55.4% | +1.9 | −10.3 |
| Hennepin | Minnesota | Senate | 664,237 | 73.5% | 71.8% | +1.6 | −6.9 |
| Broward | Florida | Senate | 659,761 | 66.3% | 58.6% | +7.7 | −17.5 |
| Bexar | Texas | Governor | 659,522 | 65.7% | 54.9% | +10.8 | −8.4 |
| Kings | New York (preliminary) | Governor | 622,033 | 79.6% | 72.0% | +7.6 | −15.2 |
| Palm Beach | Florida | Senate | 570,107 | 55.2% | 50.4% | +4.8 | −18.2 |
| Travis | Texas | Governor | 548,761 | 76.5% | 70.0% | +6.5 | −4.2 |
| Wake | North Carolina | Senate | 525,087 | 74.1% | 63.0% | +11.1 | −16.8 |
| Hillsborough | Florida | Senate | 516,454 | 54.6% | 48.5% | +6.1 | −17.1 |
| Franklin | Ohio | Senate | 505,393 | 71.9% | 64.3% | +7.5 | −11.4 |
| Queens | New York (preliminary) | Governor | 494,464 | 72.1% | 62.3% | +9.8 | −17.7 |
| New York | New York (preliminary) | Governor | 484,204 | 82.4% | 82.4% | 0.0 | −17.2 |
| Fairfax | Virginia | Senate | 479,571 | 76.3% | 68.0% | +8.3 | −14.3 |
| Cuyahoga | Ohio | Senate | 475,507 | 72.7% | 65.9% | +6.8 | −12.4 |
| Orange | Florida | Senate | 471,719 | 64.4% | 56.9% | +7.5 | −15.8 |
| Collin | Texas | Governor | 458,597 | 52.3% | 44.3% | +8.0 | −8.4 |
| Fulton | Georgia | Governor | 456,728 | 73.9% | 72.7% | +1.2 | −11.0 |
| Mecklenburg | North Carolina | Senate | 441,717 | 77.4% | 66.7% | +10.6 | −18.4 |
| Macomb | Michigan | Senate | 418,419 | 49.1% | 43.0% | +6.1 | −13.2 |
| Pinellas | Florida | Senate | 403,408 | 50.3% | 47.4% | +3.0 | −17.1 |
These are the 25 counted counties with the most votes cast in 2026. Every county’s result, 1,449 counties in 18 states, is on the map page, by state, below the map.
Method
Results are unofficial, from state and county election authorities, from counts read between November 4, 2026, at 3:31 PM ET and November 11, 2026, at 11:01 AM ET; none are certified. The 2024 baseline is the certified presidential result by county.
Our voter file was pulled in September 2026, almost two years after the 2024 vote. In 71 counties it holds fewer than 80% of the people who voted there in 2024, or fewer registered voters than 2024 votes, so those counties are left out of the turnout figures. Their swing stays in.
We corrected the 2022 baseline in 10 counties where our earlier file had the wrong 2022 totals: Clare, Gratiot, Keweenaw, Mackinac, Monroe and Wayne in Michigan, and Chenango, Otsego, Putnam and Ulster in New York. Michigan’s 2022 baseline now comes from the state’s official results file, which moves 39 other Michigan counties by a few votes each.
Michigan had no Senate race in 2022, so its 2022 turnout baseline is the 2022 governor’s race.
In Arkansas, Idaho, Louisiana, Minnesota, New Hampshire, Ohio, Oklahoma, Rhode Island, South Carolina, Texas, Virginia and Vermont, there’s no 2022 county baseline, so they’re left out of the 2022 turnout comparison.
Our pre-election estimates were published before the vote: https://www.pharosgraph.com/blog/pharosgraph-estimates-2026-midterms-closest-senate-governor-races.
PharosGraph’s neighborhood audiences are in the LiveRamp Data Marketplace: search PharosGraph.
See the shift from 2024 in every county on the map: https://maps.pharosgraph.com/us-county-swing-2026/