Understand what is taking hold, in time to act on it.
PharosGraph is the narrative intelligence layer for campaigns, policy, corporate communications and investor relations. See which issues, narratives, and risks are gaining ground, week by week, and what to do about them while there is still time.
One Engine.
Multiple Destinations.
PharosGraph is flexible infrastructure, not a standalone dashboard. The engine scores once a week and delivers into the systems you already use.
One Connected Platform
Our products Your products Your workflows
Cadence
Live ingestion Weekly scoring Scored weekly
Granularity
Neighborhood Census block group Voter level on your file
Actionability
Priorities Audiences Messaging Measurement Recommended actions
What are you here
to move?
One intelligence engine, five kinds of work. Pick the solution built for yours, each one shows the question, the read, and how the intelligence was deployed.
Win the election, then hold the ground after it.
Explore Living Voter IntelligenceTurn changing priorities into addressable audiences.
Explore Audience ActivationCompare media exposure with changes in narrative momentum, affinity and behavior.
Explore MeasurementMap any bill you are working on to what the electorate cares about in every community it touches.
Explore Policy IntelligenceConnect management messaging, media coverage and stakeholder response.
Explore Corporate Narrative IntelligenceUnited States · Data Center Communities
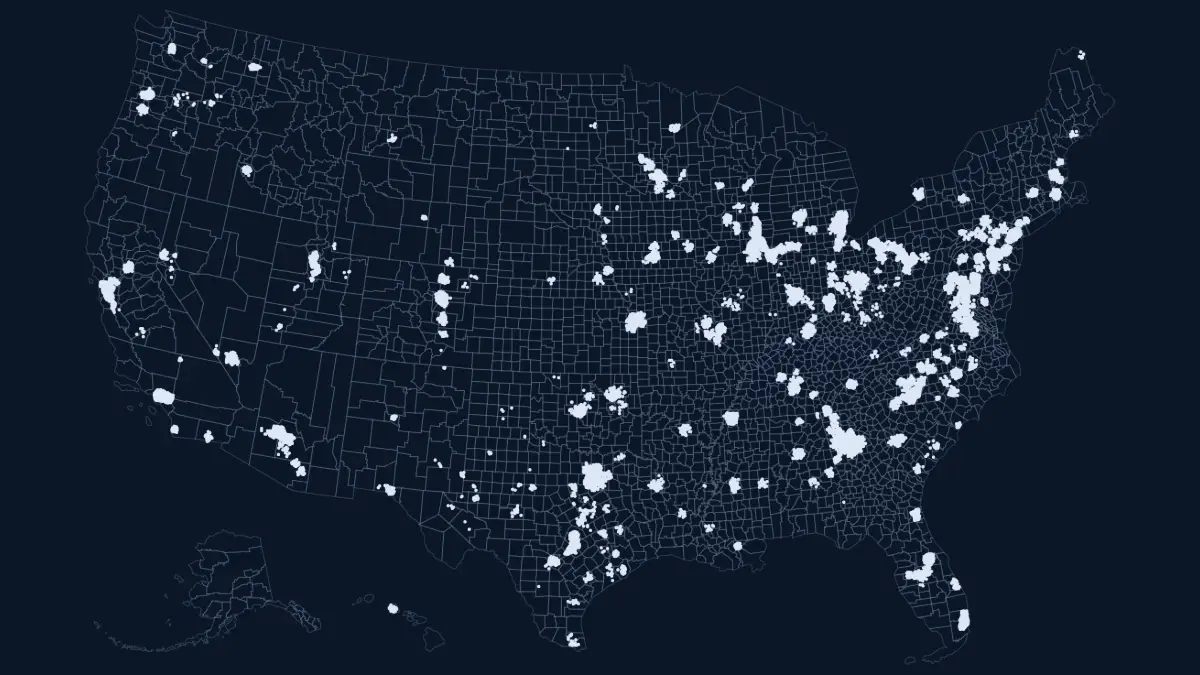
United States · voters near data center sites. Every voter in the Data Centers Community Impact audience, near an operating, announced or contested site.
Cost of Living · Voter by Voter
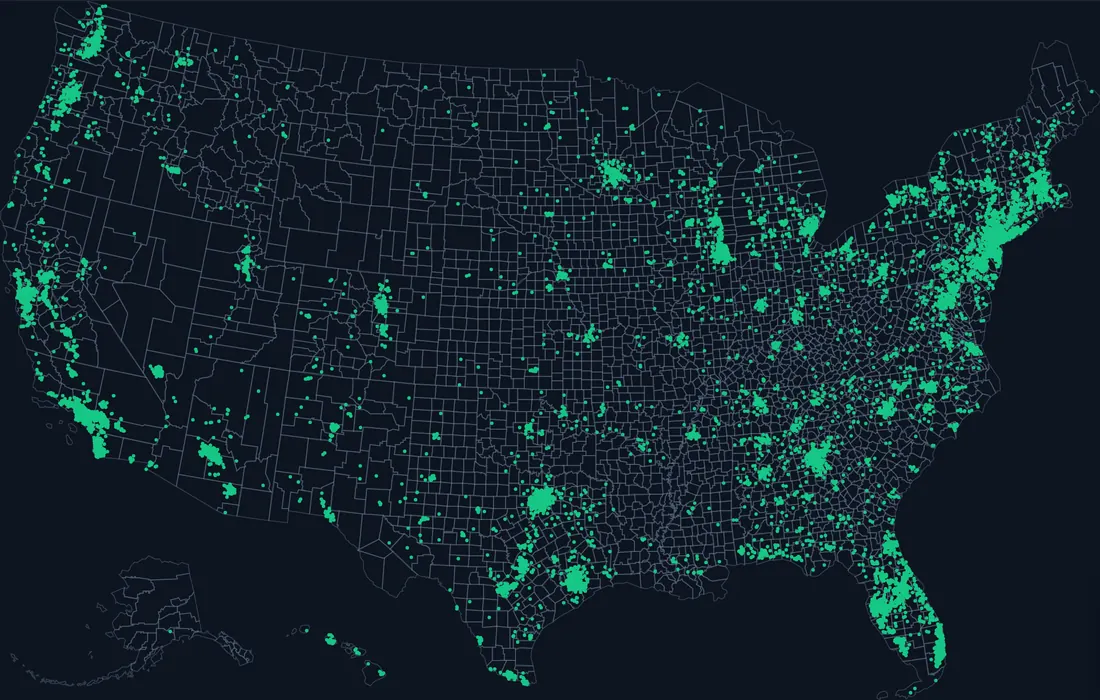
Every registered voter whose main cost of living driver is housing.
CA 2026 Governor · Working Weight


One score on the spend. Paid media graded against what is actually taking hold on the ground, scored weekly while the buy is still in flight.
California · Proposition 40, Billionaire Tax
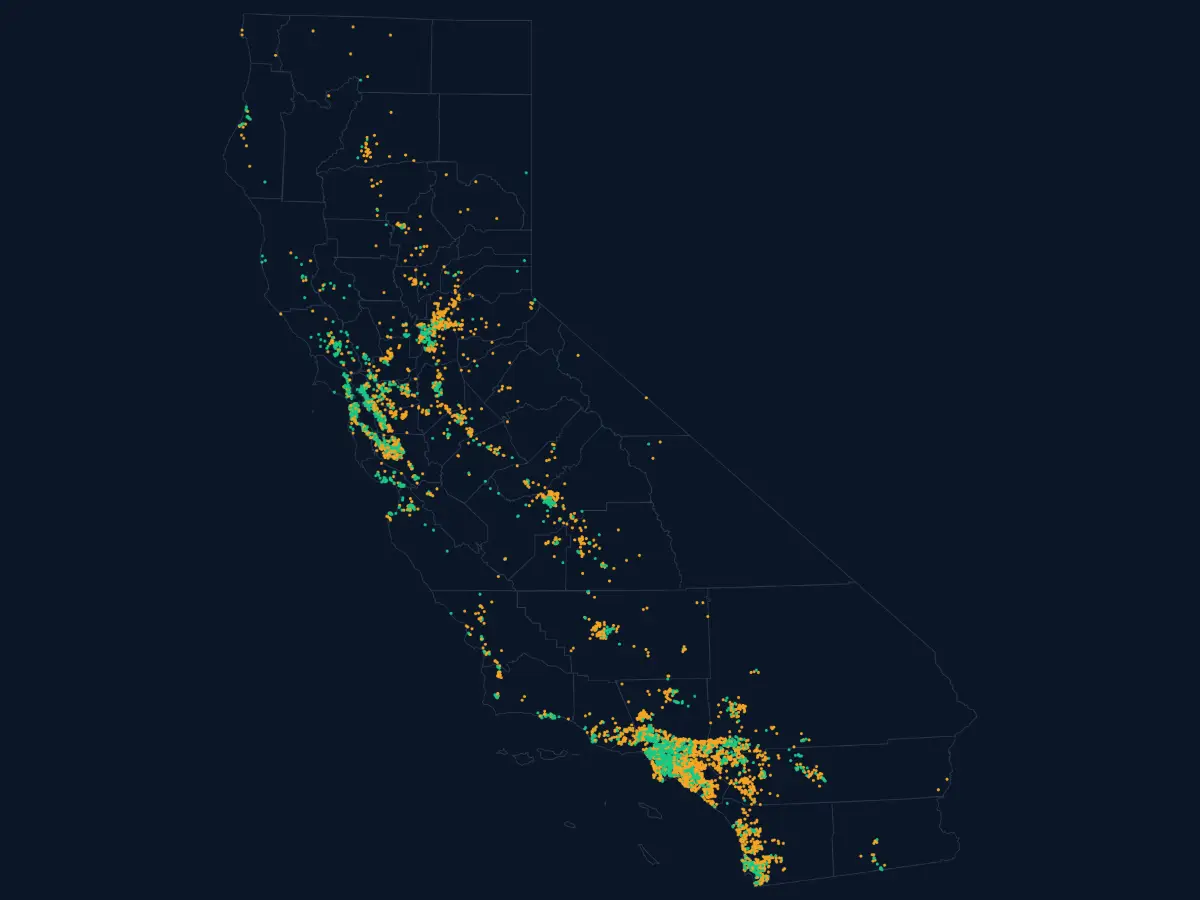
California · Proposition 40. 19,831,346 voters, each in one of two audiences. A modeled position, not local polling or a forecast of the vote.
Company X FY26 · Narrative Divergence
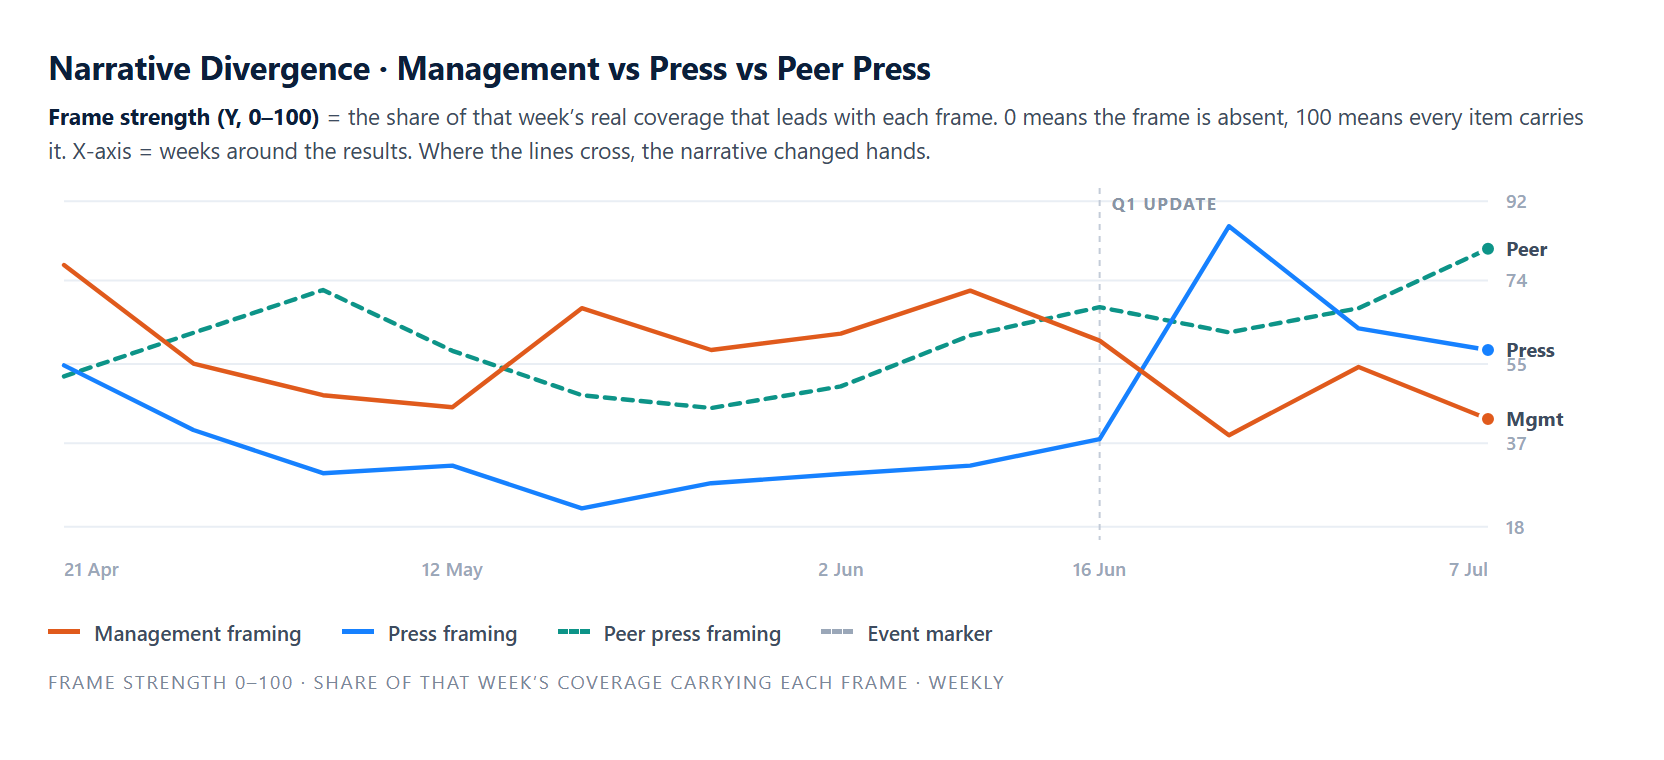
Frame strength, 0 to 100: the share of each week’s coverage that leads with each frame. Where the lines cross, the narrative changed hands. Company X, FY26 results window.
Any issue. Anywhere it is moving.
Updated every week.
From energy and data centers to healthcare, housing, taxes, education, labor, immigration, and public safety. Twenty of them are core subjects national surveys carry. The rest are local and emerging issues no survey reaches, and we add to them every week.
Bring us a campaign, an issue,
a company, a fight.
We will show you what is taking hold and where momentum is moving. Live, in your terrain, on your issue.