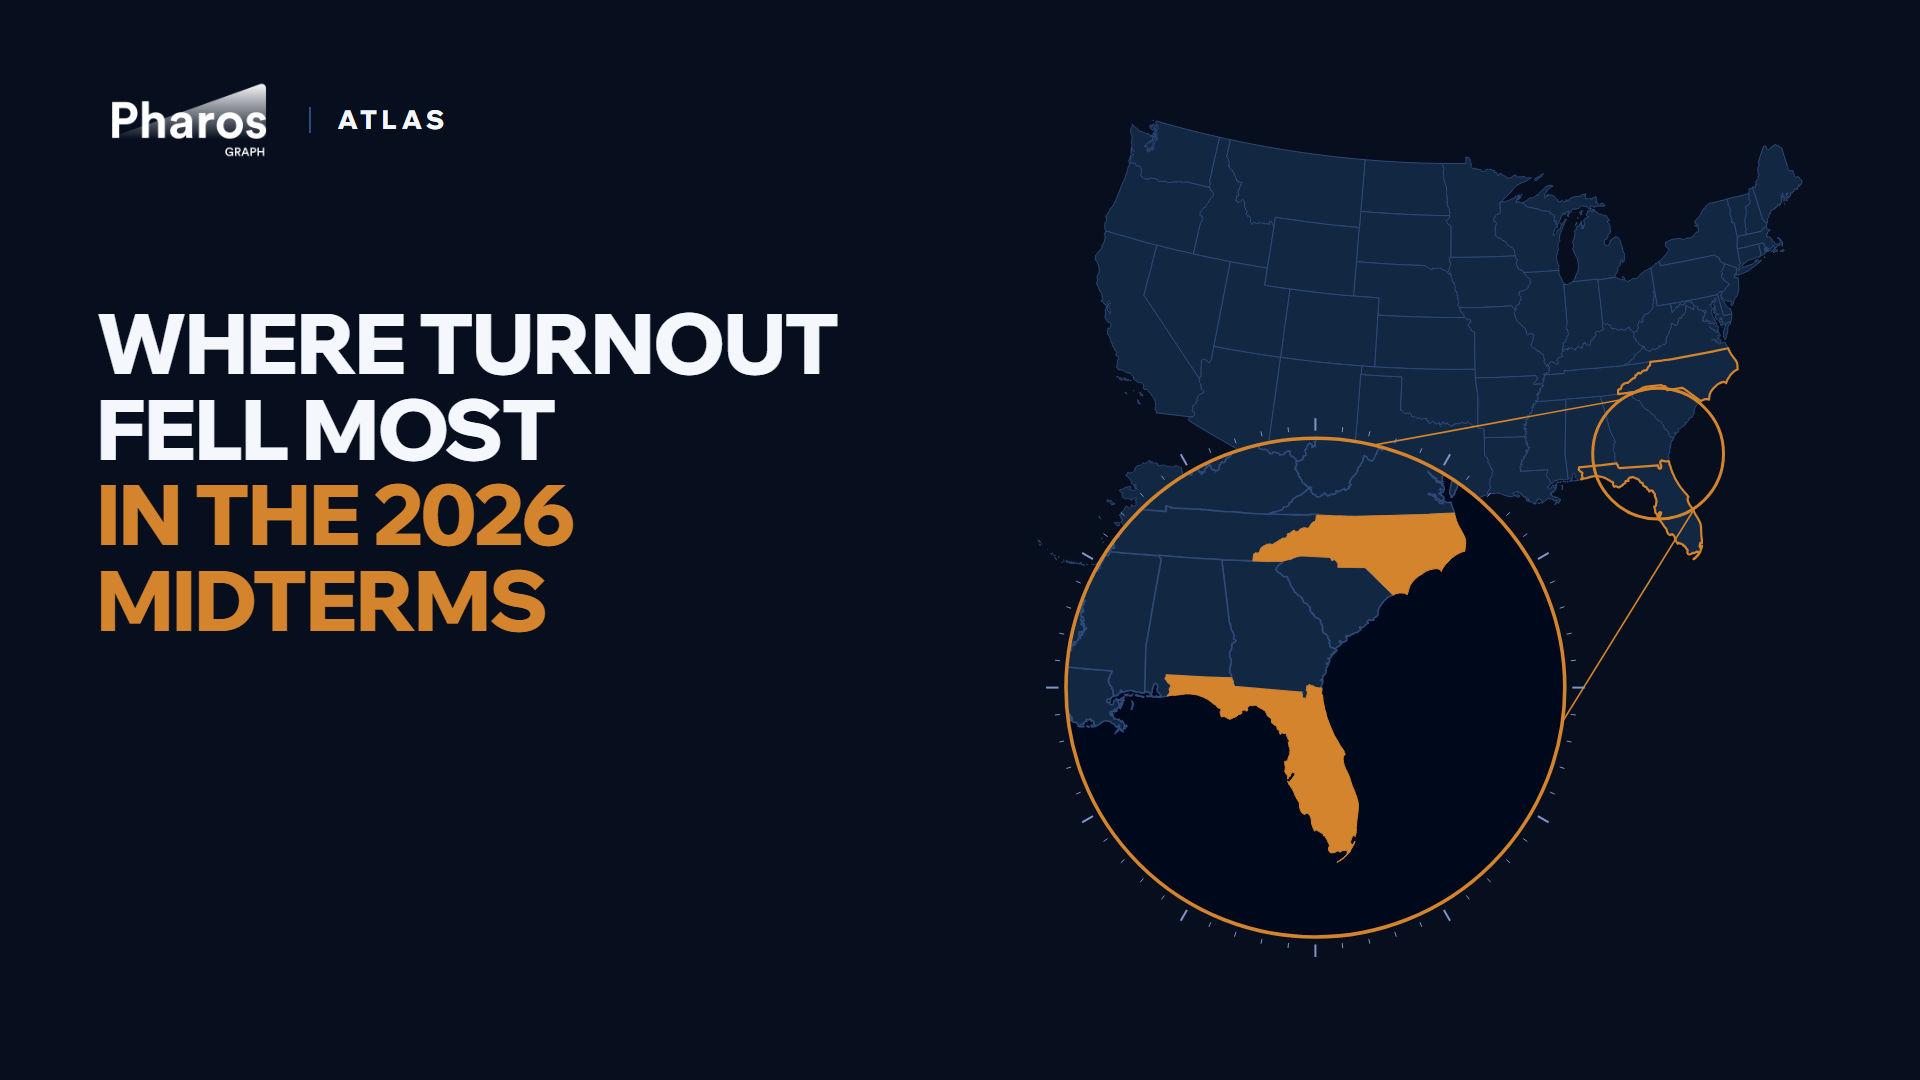
Turnout in the 2026 midterms fell an average of 19.3 points from 2024 across 3,431 precincts in Florida, North Carolina and Nebraska’s Douglas and Sarpy counties, in unofficial results through November 11, 2026. Turnout fell hardest where we said it would: in precincts where Republican registration was high and incomes were low, it fell 3.4 points more than in the state’s other precincts in Florida (95% interval −4.4 to −2.3) and 3.6 points more in North Carolina† (95% interval −5.1 to −2.1), after accounting for density and each precinct’s 2024 turnout. The same pattern held in Georgia and South Carolina, which we tested on their own because party there is inferred.
Where turnout fell in the 2026 midterms
Midterms almost always draw fewer voters than presidential years, and turnout fell in 98% of the precincts we compared. The question is where it fell more. Before the election, our plan named one pattern to test: that turnout would fall hardest in precincts where Republican registration was high and incomes were low. On October 30, 2026, before the polls closed, we fixed how we’d test it and said we’d report the answer either way.
On October 30, before any results, we registered a test that pools the states where voters register by party. As of November 11, 2026, that test covers Florida, Nebraska and North Carolina. In Nebraska, Douglas and Sarpy counties were the only ones with precinct results we could read. Pooled, turnout fell 3.5 points more (95% interval −4.5 to −2.6).
We also checked how much of the gap comes down to how these places voted in 2024. Precincts with more Republican registration also voted more Republican in 2024, so we ran the same comparison again, this time also accounting for each precinct’s 2024 two-party vote share. The gap gets smaller but doesn’t go away: turnout still fell 2.0 points more (95% interval −3.0 to −0.9). Run in each state on its own, the check holds in Florida: turnout still fell 2.5 points more (95% interval −4.0 to −0.9). In North Carolina† it’s 1.2 points (95% interval −2.3 to −0.1), right at the edge. Without Martin County’s two precincts, whose 2024 figures count only Election Day votes, it’s 1.0 points (−2.1 to +0.04), too small to tell apart from zero.
In the plain averages, the biggest drop was where both were true: 22.2 points, against 17.7 to 19.6 in the other three groups. Once density and 2024 turnout are accounted for, the combination didn’t add a clear extra drop across the three states (−1.3 points, 95% interval −3.3 to +0.6). It did in Florida (−2.9, −4.4 to −1.5); in North Carolina it went slightly the other way (+2.1, 95% interval from just above zero to +4.2).
Each precinct is compared with others in its own state. A precinct counts as high or low on Republican registration and on income relative to its state’s median registered voter, so each half holds the same number of voters. Turnout is votes cast in each state’s statewide race with the most votes, divided by registered voters, and the 2024 figure uses the same registered voters.
State by state
We also ran the same comparison in each of the eight states whose precinct results we read for this version, including states not on our October 30 registration list. Nebraska and Texas had too few counties to test as of November 11, 2026. Of the other six, five showed the same gap; in New Hampshire the gap was too small to tell apart from zero.
States with party registration
New York and New Hampshire are shown here but aren’t in the pooled result: New York’s count isn’t final yet and New Hampshire wasn’t on the list of states we set on October 30.
| State | Turnout gap (points) | 95% interval | Clear difference |
|---|---|---|---|
| Florida | −3.4 | −4.4 to −2.3 | yes |
| Nebraska (Douglas and Sarpy counties only) | only two counties, too few to test | ||
| North Carolina† | −3.6 | −5.1 to −2.1 | yes |
| New York (count ongoing) | −3.4 | −4.9 to −1.8 | yes |
| New Hampshire (not on our October 30 list, added after the results) | −1.2 | −3.2 to +0.8 | no, too small to tell apart from zero |
States without party registration, where party is inferred from primary ballots and a model
These are tested on their own only and aren’t in the pooled result.
| State | Turnout gap (points) | 95% interval | Clear difference |
|---|---|---|---|
| Georgia | −3.9 | −5.3 to −2.6 | yes |
| South Carolina | −3.8 | −5.2 to −2.3 | yes |
| Texas | only three counties, too few to test |
A state can be tested on its own only with compared precincts in at least five counties, because the 95% interval allows for precincts in the same county moving together.
† In 34 North Carolina counties, including Wake, Mecklenburg and Guilford, early and mail votes are reported as a single countywide total instead of precinct by precinct, so we can’t compare those counties’ precincts. North Carolina’s figures cover the state’s other counties.
Among the precincts compared in this analysis, averaged by county and weighted by registered voters, turnout fell most in North Carolina’s Randolph (30.9 points), Alexander (30.1) and Columbus (28.8) counties, and in Florida’s Baker (27.5), Dixie (24.8) and Holmes (24.7) counties.
Table: turnout change from 2024, by registration and income
| Where | Registration and income | Precincts | Registered voters | Turnout 2024 | Turnout 2026 (unofficial) | Change (points) | 95% interval |
|---|---|---|---|---|---|---|---|
| Florida, Nebraska and North Carolina, pooled | High Republican registration, low income | 816 | 1,882,822 | 79.2% | 56.9% | −22.2 | −23.2 to −21.2 |
| High Republican registration, high income | 877 | 2,509,218 | 83.1% | 63.6% | −19.6 | −20.9 to −18.2 | |
| Low Republican registration, low income | 1,080 | 2,517,070 | 68.0% | 50.3% | −17.7 | −18.9 to −16.4 | |
| Low Republican registration, high income | 658 | 1,882,705 | 77.1% | 58.8% | −18.2 | −19.7 to −14.3 | |
| Florida | High Republican registration, low income | 522 | 1,282,600 | 77.6% | 56.8% | −20.8 | −22.2 to −19.4 |
| High Republican registration, high income | 494 | 1,589,405 | 82.2% | 64.5% | −17.7 | −19.5 to −14.9 | |
| Low Republican registration, low income | 584 | 1,592,226 | 64.1% | 47.9% | −16.3 | −17.7 to −13.1 | |
| Low Republican registration, high income | 413 | 1,284,645 | 74.0% | 55.8% | −18.3 | −19.7 to −10.9 | |
| Georgia (party inferred) | High Republican registration, low income | 519 | 1,136,087 | 73.4% | 54.6% | −18.8 | −19.6 to −18.0 |
| High Republican registration, high income | 423 | 1,445,336 | 76.4% | 60.8% | −15.6 | −16.8 to −14.6 | |
| Low Republican registration, low income | 571 | 1,451,452 | 61.5% | 51.1% | −10.3 | −12.1 to −9.0 | |
| Low Republican registration, high income | 334 | 1,132,304 | 69.1% | 59.0% | −10.1 | −11.6 to −8.3 | |
| North Carolina† | High Republican registration, low income | 270 | 565,356 | 82.7% | 56.7% | −26.0 | −27.3 to −24.4 |
| High Republican registration, high income | 257 | 728,004 | 84.4% | 60.0% | −24.4 | −26.1 to −22.9 | |
| Low Republican registration, low income | 361 | 731,651 | 74.7% | 53.4% | −21.2 | −22.8 to −19.5 | |
| Low Republican registration, high income | 222 | 563,813 | 83.5% | 65.0% | −18.4 | −20.6 to −16.6 | |
| Nebraska (Douglas and Sarpy counties only) | High Republican registration, low income | 24 | 34,866 | 83.2% | 64.8% | −18.5 | −20.2 to −17.1 |
| High Republican registration, high income | 126 | 191,809 | 86.6% | 70.6% | −16.0 | −16.6 to −15.6 | |
| Low Republican registration, low income | 135 | 193,193 | 74.1% | 58.2% | −15.9 | −18.9 to −15.4 | |
| Low Republican registration, high income | 23 | 34,247 | 84.7% | 70.0% | −14.7 | −15.3 to −14.6 | |
| New Hampshire (not on our October 30 list) | High Republican registration, low income | 76 | 187,724 | 79.5% | 61.1% | −18.4 | −19.7 to −17.3 |
| High Republican registration, high income | 50 | 315,875 | 81.4% | 62.1% | −19.3 | −19.5 to −18.5 | |
| Low Republican registration, low income | 71 | 383,611 | 75.5% | 57.3% | −18.2 | −19.4 to −16.2 | |
| Low Republican registration, high income | 32 | 154,022 | 80.4% | 65.8% | −14.6 | −15.6 to −13.3 | |
| New York (count ongoing) | High Republican registration, low income | 1,038 | 1,085,475 | 56.9% | 39.0% | −17.9 | −19.6 to −16.3 |
| High Republican registration, high income | 1,249 | 1,435,222 | 67.5% | 48.5% | −19.0 | −20.8 to −17.7 | |
| Low Republican registration, low income | 1,245 | 1,437,100 | 50.5% | 35.7% | −14.8 | −16.7 to −13.7 | |
| Low Republican registration, high income | 903 | 1,086,098 | 64.5% | 49.4% | −15.0 | −16.2 to −13.9 | |
| South Carolina (party inferred) | High Republican registration, low income | 373 | 498,806 | 76.7% | 57.7% | −19.0 | −20.3 to −18.0 |
| High Republican registration, high income | 562 | 1,031,621 | 80.0% | 64.0% | −16.0 | −16.9 to −15.1 | |
| Low Republican registration, low income | 852 | 1,033,550 | 68.5% | 55.3% | −13.2 | −14.5 to −11.8 | |
| Low Republican registration, high income | 282 | 499,632 | 74.5% | 61.5% | −13.0 | −15.0 to −10.7 |
Change: 2026 turnout minus 2024 turnout, both over the same registered voters, averaged over precincts weighted by registered voters. High and low are relative to the state’s median registered voter.
Table: turnout change against each characteristic
| Where | Characteristic | Turnout change for a precinct one standard deviation above its state’s average (points) | 95% interval | Accounted for |
|---|---|---|---|---|
| Florida | Median household income | +2.1 | +0.6 to +3.5 | 2024 vote, density and 2024 turnout |
| Florida | Republican registration (mostly the same as what is accounted for; read with care) | +8.9 | +5.9 to +12.0 | 2024 vote, density, income and 2024 turnout |
| Florida | Average turnout propensity (modeled) | +8.3 | +6.9 to +9.7 | 2024 vote, density, income and 2024 turnout |
| Georgia (party inferred) | Median household income | +1.8 | +1.4 to +2.2 | 2024 vote, density and 2024 turnout |
| Georgia (party inferred) | Republican registration (mostly the same as what is accounted for; read with care) | +2.3 | +1.2 to +3.4 | 2024 vote, density, income and 2024 turnout |
| Georgia (party inferred) | Average turnout propensity (modeled) | +2.0 | +1.3 to +2.7 | 2024 vote, density, income and 2024 turnout |
| North Carolina† | Median household income | +2.2 | +1.5 to +2.9 | 2024 vote, density and 2024 turnout |
| North Carolina† | Republican registration (mostly the same as what is accounted for; read with care) | +0.3 | −1.2 to +1.7 | 2024 vote, density, income and 2024 turnout |
| North Carolina† | Average turnout propensity (modeled) | +4.1 | +2.9 to +5.2 | 2024 vote, density, income and 2024 turnout |
| New Hampshire (not on our October 30 list) | Median household income | +0.8 | +0.5 to +1.1 | 2024 vote, density and 2024 turnout |
| New Hampshire (not on our October 30 list) | Republican registration (mostly the same as what is accounted for; read with care) | +3.0 | +1.3 to +4.7 | 2024 vote, density, income and 2024 turnout |
| New Hampshire (not on our October 30 list) | Average turnout propensity (modeled) (mostly the same as what is accounted for; read with care) | +2.7 | +1.4 to +4.0 | 2024 vote, density, income and 2024 turnout |
| New York (count ongoing) | Median household income | +3.4 | +2.4 to +4.5 | 2024 vote, density and 2024 turnout |
| New York (count ongoing) | Republican registration (mostly the same as what is accounted for; read with care) | +4.2 | −2.5 to +11.0 | 2024 vote, density, income and 2024 turnout |
| New York (count ongoing) | Average turnout propensity (modeled) | +10.1 | +9.0 to +11.2 | 2024 vote, density, income and 2024 turnout |
| South Carolina (party inferred) | Median household income | +1.5 | +1.0 to +2.0 | 2024 vote, density and 2024 turnout |
| South Carolina (party inferred) | Republican registration (mostly the same as what is accounted for; read with care) | +2.4 | +1.2 to +3.6 | 2024 vote, density, income and 2024 turnout |
| South Carolina (party inferred) | Average turnout propensity (modeled) | +2.3 | +1.9 to +2.7 | 2024 vote, density, income and 2024 turnout |
Each figure accounts for the other characteristics, the 2024 vote, density, income and each precinct’s 2024 turnout, never the characteristic itself.
How we did this
PharosGraph scores registered voters on their top issues, likelihood to vote and party, and rolls those scores up to about 235,000 neighborhoods (2020 Census block groups with enough registered voters to publish). The profile was frozen on November 1, before Election Day. The results are modeled estimates. Voter file data: L2.
Results are unofficial, pulled from state and county election offices as of November 11, 2026, at 10:01 AM ET (Florida: November 6, 2026, at 11:01 AM ET; New Hampshire: November 5, 2026, at 12:07 PM ET; New York: November 5, 2026, at 11:15 AM ET); none are certified. Turnout is measured against the voter file’s registration, not the rolls on Election Day (Florida: October 28, 2026; Georgia: September 4, 2026; North Carolina: September 4, 2026; Nebraska: October 28, 2026; New Hampshire: September 4, 2026; New York: October 28, 2026; South Carolina: September 4, 2026; Texas: November 5, 2026).
A precinct is compared only when its county meets the counting rule below, its precinct totals add up to the county total, its early and mail votes are assigned to real precincts, its name matches between 2024 and 2026, its turnout is between 5% and 105% of registration in both years, and it has at least 50 registered voters. We also leave out a county’s precincts when, taken together, they move more than 15% apart from the county’s own total between 2024 and 2026. That’s a sign votes were counted outside the precincts in one of the two years, or that precinct lines changed. This leaves out 141 precincts in Florida (Escambia, Hillsborough and Orange counties) and 58 in North Carolina (Bladen, Camden, Hoke, Perquimans and Watauga).
In four Florida counties (Alachua, Duval, Hardee and Monroe), only some precincts match a 2024 precinct, and the 2024 one often covers a different area, so their turnout change isn’t reliable. They stay in under the rule we set before the results. Without them, the gap is 3.1 points in Florida (95% interval −4.2 to −2.1) and 3.3 points across the three states (−4.2 to −2.4). We ran the same check without Citrus, Levy and Martin counties, where under a quarter of registered voters could be compared. The main result holds: 3.5 points across the three states (95% interval −4.5 to −2.6), 3.4 in Florida (−4.5 to −2.3) and 3.5 in North Carolina (−4.9 to −2.0).
Estimates are weighted by registered voters, with intervals that allow for precincts in the same county moving together. We planned to compare only counties whose count was final. To publish while counting continues, we used counties at least 95% reported and unchanged between two reads an hour apart. We’ll update as counts finish, and the original figures stay visible.
The comparison covers 3,431 precincts in 97 counties: 59 in North Carolina, 36 in Florida and two in Nebraska. Florida is kept at its last good results: county results as of November 6, 11:01 AM ET, the state’s complete file (all 5,626 precincts); every pull of the state’s results file from November 9 to November 11 came back empty, so the last good one is kept. New Hampshire is kept at its last good results: results as of November 5, 12:07 PM ET; since then the state’s totals sheet differs by one vote from the sum of its towns, so the last good one is kept.
The main result covers only the states with party registration whose precinct results we could compare. New York’s count is not yet final, so its precincts are shown on their own line and are not part of the main result. New Hampshire wasn’t on the list of states we set on October 30, so it’s shown on its own line, added after the results. In 34 North Carolina counties, including Wake, Mecklenburg and Guilford, early and mail votes are reported as a single countywide total instead of precinct by precinct, so we can’t compare those counties’ precincts. North Carolina’s figures cover the state’s other counties.
The test and its controls were fixed on October 30, 2026, before the polls closed. Our race estimates were locked before the polls closed.
Arkansas, Colorado, Hawaii, Idaho, Iowa, Louisiana, Oklahoma, Rhode Island, Virginia, West Virginia and Wyoming have posted precinct results, but they aren’t part of this version. Connecticut and Vermont report results by town, not by precinct, so they aren’t part of this version. Arizona and Pennsylvania were still counting as of November 11. Alabama, Alaska, California, Delaware, Illinois, Kansas, Kentucky, Maine, Maryland, Massachusetts, Minnesota, Mississippi, Montana, Nevada, New Jersey, New Mexico, Ohio, Oregon, South Dakota, Tennessee and Wisconsin hadn’t posted precinct results as of November 11. Michigan isn’t part of this version: many precincts were redrawn and renumbered after 2024, so most can’t be compared with 2024.
PharosGraph’s neighborhood audiences are in the LiveRamp Data Marketplace: search PharosGraph.