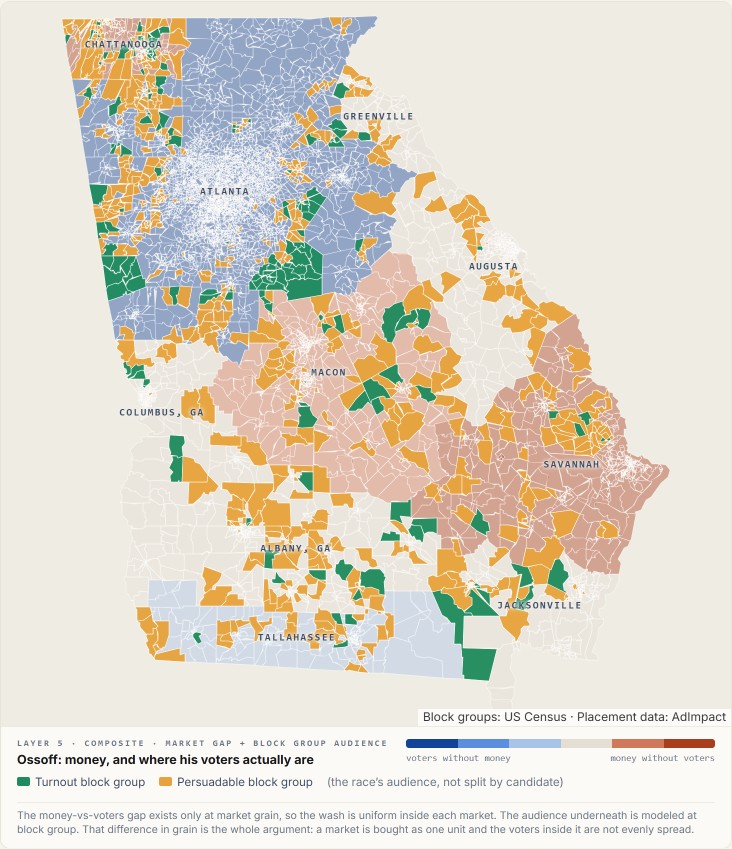
In Georgia’s Senate race, one campaign spent $75,360 last week in a television market that reaches almost none of its own voters, and more than three times what its opponent spent there to reach his.
In the week of August 31, about $95,000 of Jon Ossoff’s television buy, roughly 7% of it, ran in three markets that hold neither group for him: Chattanooga, Jacksonville and Greenville-Spartanburg. No measurable turnout voters, and no measurable persuadables. Chattanooga is the clearest case, and it is not carelessness. The market reaches five Georgia counties, so it delivers real Georgia airtime and would clear any geographic filter a buyer applied. But the Georgians inside it who are in play are Mike Collins’s turnout voters, not anyone Ossoff can turn out or persuade. Ossoff spent $75,360 there. Collins spent $23,048.
A television market is bought as one unit. The voters inside it are not evenly spread.
That one market sits inside a wider shift. Through mid-July, Ossoff’s money tracked his persuadable voters more closely than it tracked his own turnout voters. In the week of July 27, when Collins came on air with $1.66 million after spending $22 the week before, Ossoff’s Atlanta share fell from 81% to 64% and his money moved toward the people already leaning his way. It has stayed there since. We are describing timing, not motive, and there is a fair reading in which the move is right: if Atlanta is close to saturated, the next dollar may do more outside it, and we score opportunity by where voters live rather than by what a crowded market still returns. Both readings sit on the same numbers. The useful question is not whether a campaign covered the state, but which of its voters the money was built for, and whether those were the ones it meant.
Ossoff: money, and where his voters actually are
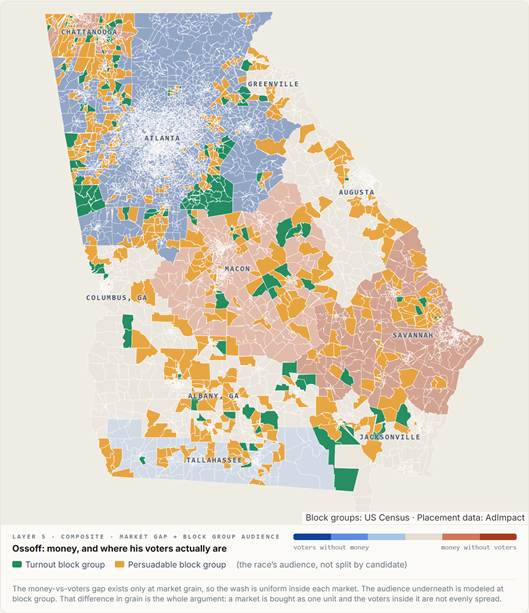
Georgia, week of August 31, 2026. The shading compares Ossoff’s spending in each television market against the share of his voters who live there: blue where there are more of his voters than his money, red where there is more money than voters. Atlanta is the largest blue, at 14.3 points of opportunity he did not buy. The shapes drawn on top are the 896 neighborhoods that hold this race’s contested voters, green for turnout voters and orange for persuadable voters. A market is bought whole, but the voters inside it are not spread evenly, and that mismatch is the point. The neighborhoods shown belong to the race, not to either candidate.
What each of us brings. Television is sold by market, not by voter. AdImpact tracks what every campaign paid for and where it ran. PharosGraph answers the other half of the question: who is actually reachable in Georgia right now, and by whom.
A candidate’s voters are not one group, so PharosGraph models two. Turnout voters already lean his way and need a reason to actually show up. Persuadable voters have not made up their minds and can still be moved, by either side. PharosGraph estimates both groups for both candidates in every Georgia neighborhood of roughly 1,500 people. That is a different question from who lives where, or how a county voted last time. Together, those two groups are what we mean below by a candidate’s voters. Lay that map under a media buy, and you can see where a campaign’s money and its voters stop lining up.
What this is. The Persuadable Gap is a read on political television from Causal and PharosGraph. It is a diagnostic, not a forecast. We never say who will win. We say what a buy is built for, and where it disagrees with the voter map.
How it is built. Spending and placement from AdImpact, reflecting what was bought rather than what was delivered. Turnout and persuadable voters modeled by PharosGraph at neighborhood level and rolled up to television market. Those voter maps are rebuilt periodically, and every comparison here is drawn inside a single rebuild. Figures from the run of September 9, 2026.
The Persuadable Gap · Causal and PharosGraph