Every weekday between now and Election Day on November 3, we publish one map and a short commentary on what it shows. This page holds all of them, newest at the top. The maps show how an argument is distributed across a place, and they make no projection on who will win.
What is in here
Entries come in three kinds, and the mix changes week to week. Items appear because they pique our interest, are moving rapidly, or are important to an audience, group or geography.
- Races. How a contest is being argued: the vocabulary each side uses, the issues where both sides are engaged, and the ground a candidate is currently not speaking to. Where a race has a state debate, its entry runs the week before it.
- Audiences. Which Audiences a state or a district holds, how they are spread across it, and where the same message lands differently between them.
- AdScape™. Where the advertising money is placed, and how that placement aligns with the issues a market is engaged on.
Ask for what you want to see
There is more material than there are weekdays before November 3, which makes the schedule a set of choices. Tell us what you want in it. If there is a race, a state, a district or an Audience you want covered, comment on the day’s post on LinkedIn or write to _info@pharosgraph.com._ A request that arrives by Wednesday can reach the following week’s schedule.
Go deeper on any entry
An entry is a few lines on one map, so most of what sits behind it stays off the page. If something here raises a question about your own state, your own district, or an Audience you work with, the team is glad to talk it through. Write to info@pharosgraph.com and name the entry that prompted it.
Georgia Governor & Senate
Thursday, October 8th
In Georgia, 1.1 million voters who live far from the nearest hospital are in play in both the governor’s race and the Senate race. Early voting opens October 13, the day of the Atlanta Press Club’s Senate debate.
They’re among 3,108,892 Georgia voters who live far enough from a hospital that getting care is a local issue.
For anyone running health care ads, that overlap matters. The same voters count in both races: Keisha Lance Bottoms against Rick Jackson for governor, and Mike Collins against Jon Ossoff for Senate.
Of the 1.1 million, 77 percent voted in 2024.
The interactive map shows where these voters are concentrated, and the audiences are available through L2, Inc.: https://lnkd.in/gi-xumWJ
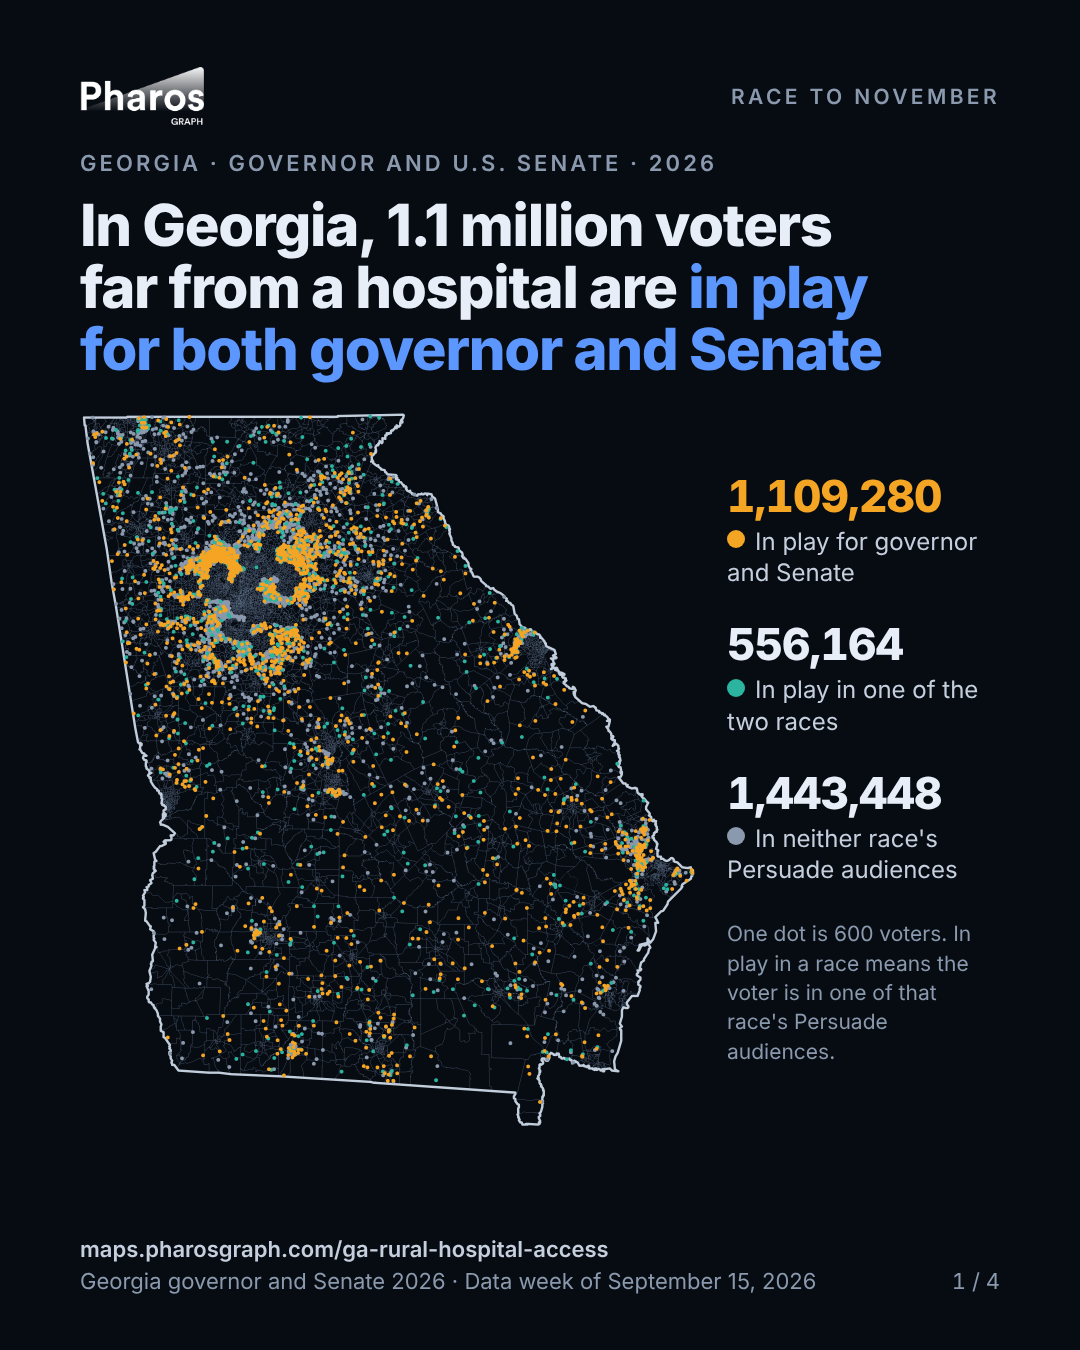
The voters on the map are in PharosGraph Rural Hospital and Healthcare Access Community Impact, grouped by whether they’re also in the Persuade audiences for the two races: PharosGraph GA Governor 2026 Democratic Persuade, PharosGraph GA Governor 2026 Republican Persuade, PharosGraph GA Senate 2026 Democratic Persuade and PharosGraph GA Senate 2026 Republican Persuade. All five audiences are available now through L2 in LiveRamp and L2 DataMapping.
See the map: https://maps.pharosgraph.com/ga-rural-hospital-access/
New York 17th District
Wednesday, October 7th
Mike Lawler and Cait Conley debate again on October 14, and the cost of living has ranked first in our weekly read of their race in New York’s 17th District in 12 of the last 14 weeks.
For more than one in six voters there, the cost that weighs most is the property tax bill. That’s 87,711 voters or 17 percent of the district against just six percent across New York state. The state and local tax deduction is among the top ranked issues in only seven of the races we track, five of them in New York.
All 87,711 voters are homeowners, and 88 percent voted in 2024. Of those voters, 54 percent are in the race’s Persuade audiences, against 45 percent of all voters in the district.
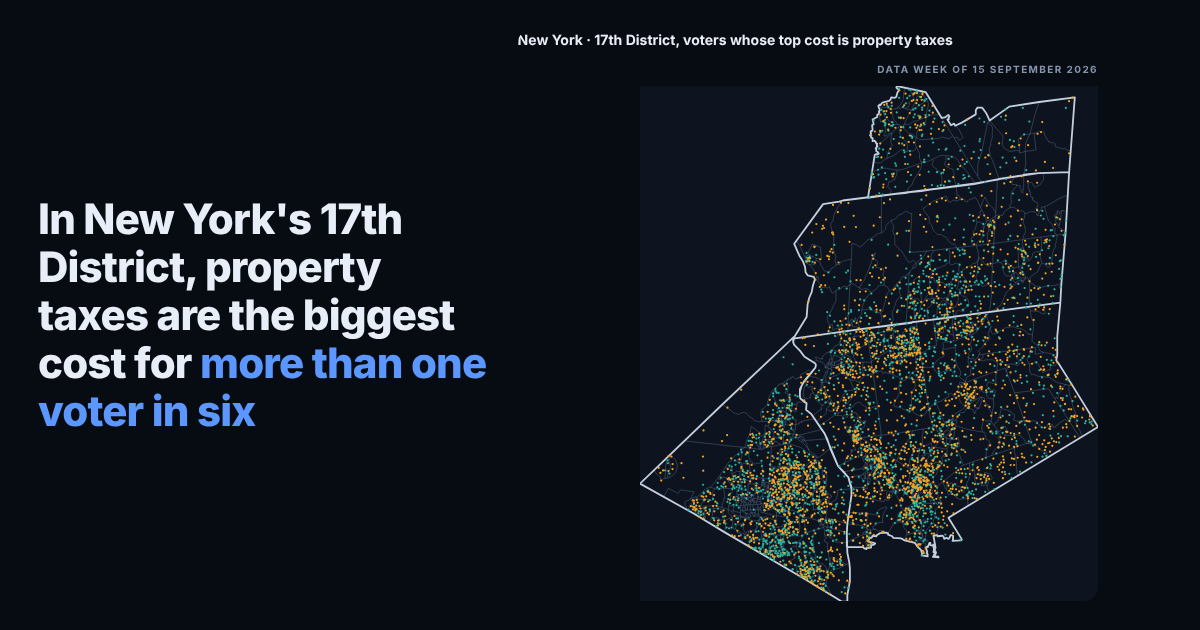
See the interactive map: The voters on it are in PharosGraph Cost of Living Driven by Property Taxes, split by whether they’re also in PharosGraph NY Congressional District 17 Democratic Persuade or PharosGraph NY Congressional District 17 Republican Persuade. All three audiences are available now through L2 in LiveRamp and L2 DataMapping, from the data week of September 15.
Texas Senate
Monday, October 5th
Today is the last day to register to vote in Texas. From here, the tight Senate race between Ken Paxton and James Talarico is a contest for voters already on the rolls.
Immigration ranks fourth among the issues in our weekly read of the race, and where voters stand on it says a lot about who’s still in play. Of the 3.2 million Texas voters in both candidates’ Persuade audiences, 60 percent sit in the middle three bands of our five-point immigration scale. Those bands hold 37 percent of all Texas voters.
Centrists stand out. More than a third of them are in play for both candidates, close to twice the statewide rate.
Each band comes with its own matched message, so a campaign can reach each voter where they actually stand on the issue.
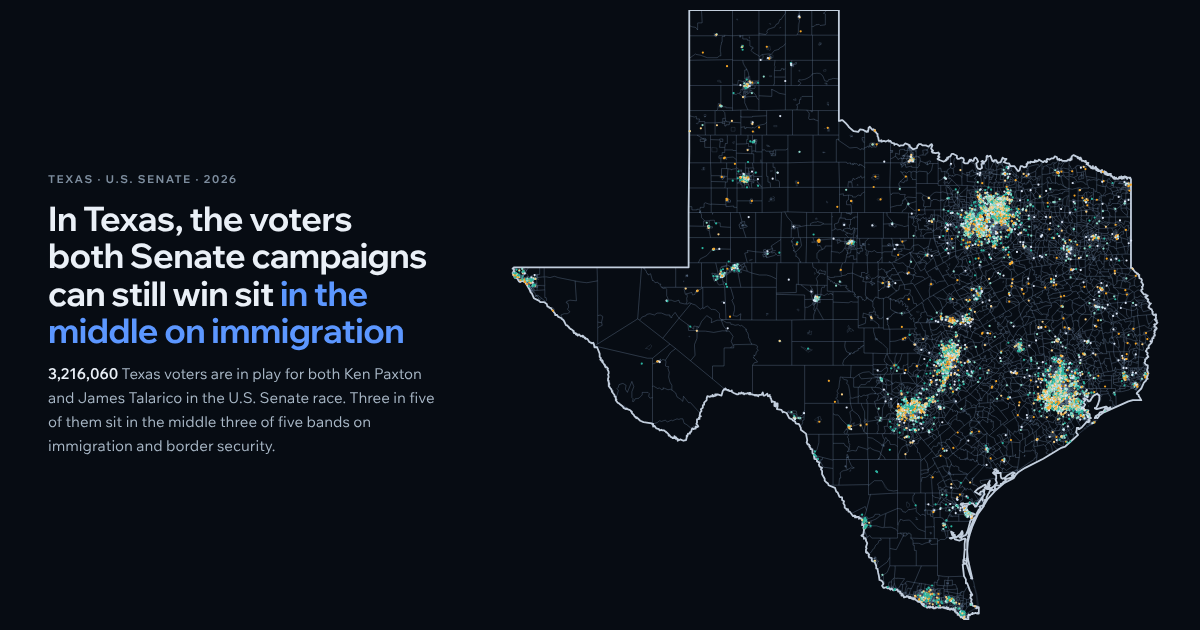
The voters on it are in both PharosGraph TX Senate 2026 Persuade audiences, colored by the five PharosGraph Immigration and Border Security lean audiences, from Progressive to Conservative. All of them are available now through L2 in LiveRamp and L2 DataMapping. See the interactive map here: https://maps.pharosgraph.com/tx-immigration-lean/
Iowa Senate
Friday, October 2nd
Close to six in ten Iowa voters live in communities where farm livelihoods face cost, land and water pressure. And more than half of them are still persuadable in the Senate race, the governor’s race or both.
Iowa’s harvest is under way, and the state’s corn growers asked their congressional delegation last week for diesel relief, with prices close to double a year ago. Agriculture has ranked among the top five issues in Iowa’s Senate race every week since mid-July.
The persuadable ones also show up to vote. Close to nine in ten voted in 2024, versus about eight in ten Iowa voters overall.
Josh Turek and Ashley Hinson debate on October 7, a week before absentee ballots go out.
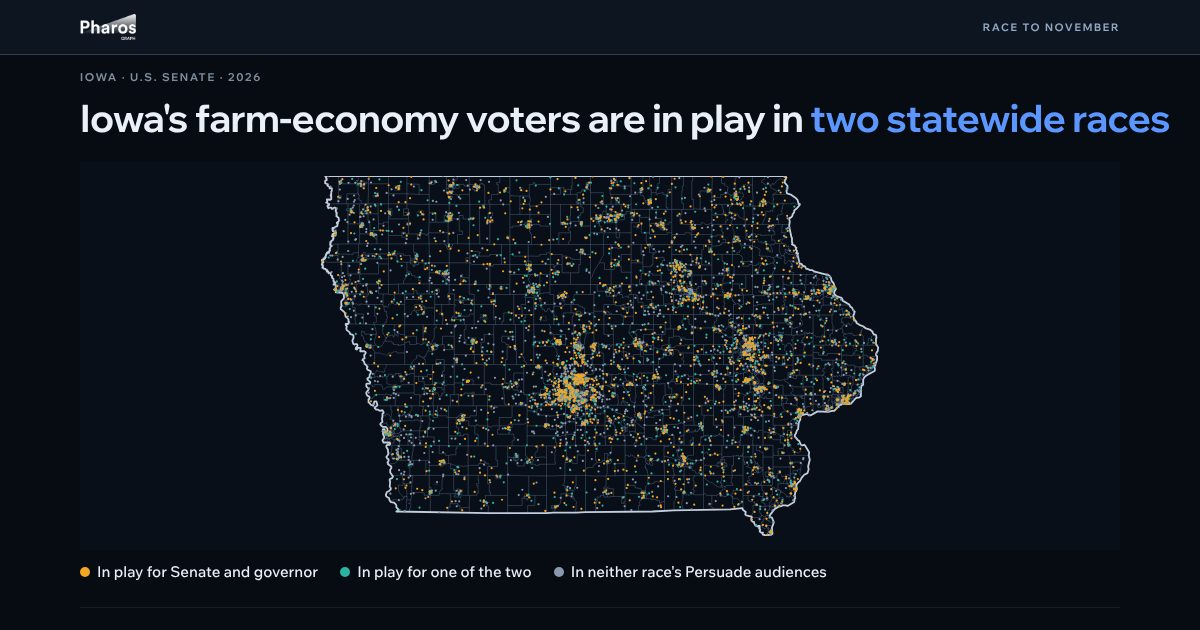
Audience: PharosGraph Agriculture and Rural Economy Community Impact, available through L2 in LiveRamp and L2 DataMapping. Data is from the week of September 15.
Check out the map showing all 1,166,071 of these voters and which ones are persuadable here: https://maps.pharosgraph.com/ia-agriculture-rural-economy/
Michigan Senate
Thursday, October 1st
Michigan opened voting on September 24, earlier than most states, and the governor and Senate debates are next week. In PharosGraph’s weekly read of the issues shaping every race we track, jobs rank second in both.
But Michigan’s jobs voters aren’t one group. Just over half of them skew young and urban, and their biggest household bills are energy and housing. For the other 46 percent, the biggest bill is childcare. Most of these jobs voters are women with children at home, living in the suburbs and small towns. For them, childcare is the cost of going to work.
The jobs voters whose biggest cost is childcare also make up about one in ten of the voters still open to persuasion in both statewide races, and they turn out. Yet childcare doesn’t rank among the top issues in any Michigan race we track. The candidates will debate jobs next week where they’ll have a chance to connect with the voters they still have to win.
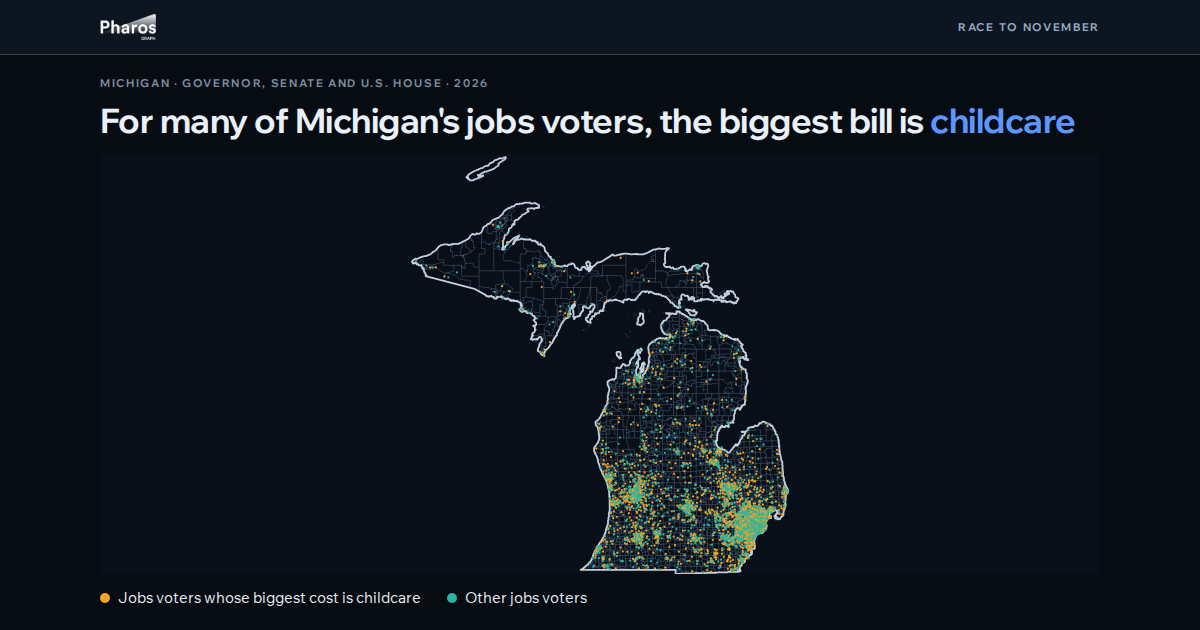
Audiences: PharosGraph Jobs Top 10 Percent Salience, Jobs 10 to 20 Percent Salience and Cost of Living Driven by Childcare Costs, plus Persuade and GOTV for Michigan’s races for governor, Senate and the House, available through L2 in LiveRamp and L2 DataMapping. Data is from the week of September 15.
Check out the interactive map here: https://maps.pharosgraph.com/mi-jobs/
Pennsylvania House
Wednesday, September 30th
Pennsylvania lawmakers came back to Harrisburg on Monday, and data center bills are on the list of what they could take up this fall. Only four states have more voters living near a proposed or operating data center, and none has more voters whose main concern about them is the electric bill.
Close to half of Pennsylvania’s registered voters, 3,983,912 of them, live in these communities. Energy costs come first for 46 percent of them, jobs and investment for 35 percent, and environment and water for 19 percent.
For anyone running data center ads, that split matters. Campaigns and interest groups can now put the electric bill message in front of the voters worried about their bill, and the jobs and water messages in front of theirs. In the 8th District, where the issue rose from eleventh to fourth in our weekly ranking this month, more than half of the persuadable voters live in these communities.
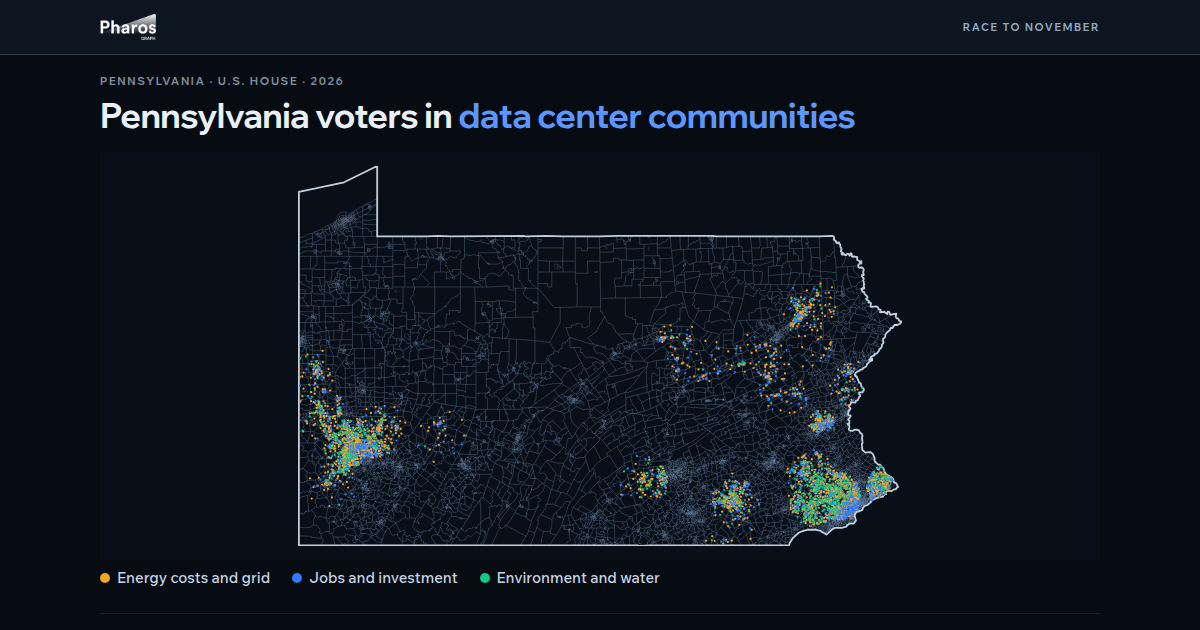
The audiences are PharosGraph Data Centers Community Impact and its three concern audiences (Energy Costs and Grid, Jobs and Investment, Environment and Water), new PharosGraph audiences available now through L2 in LiveRamp and L2 DataMapping.
Check out the interactive map here: https://maps.pharosgraph.com/pa-data-center-communities/
Arizona Governor
Tuesday, September 29th
The two candidates for Arizona secretary of state, who runs the state’s elections and is next in line to the governor, debate tomorrow night, September 30th.
In our latest read of the Arizona governor’s race, PharosGraph found that election integrity ranks sixth among all issues in the race. In Arizona, 698,653 voters are more focused on election integrity than 80 percent of voters nationwide, and about six in ten of them are flagged as Persuadable by PharosGraph in the governor’s race. Across all Arizona voters, it’s 44 percent.
These voters turn out, too: 84 percent of Arizona voters who are more tuned into election integrity voted in 2024, against 73 percent statewide. These voters are now available for activation through L2, Inc. and LiveRamp along with hundreds of other new PharosGraph audiences.
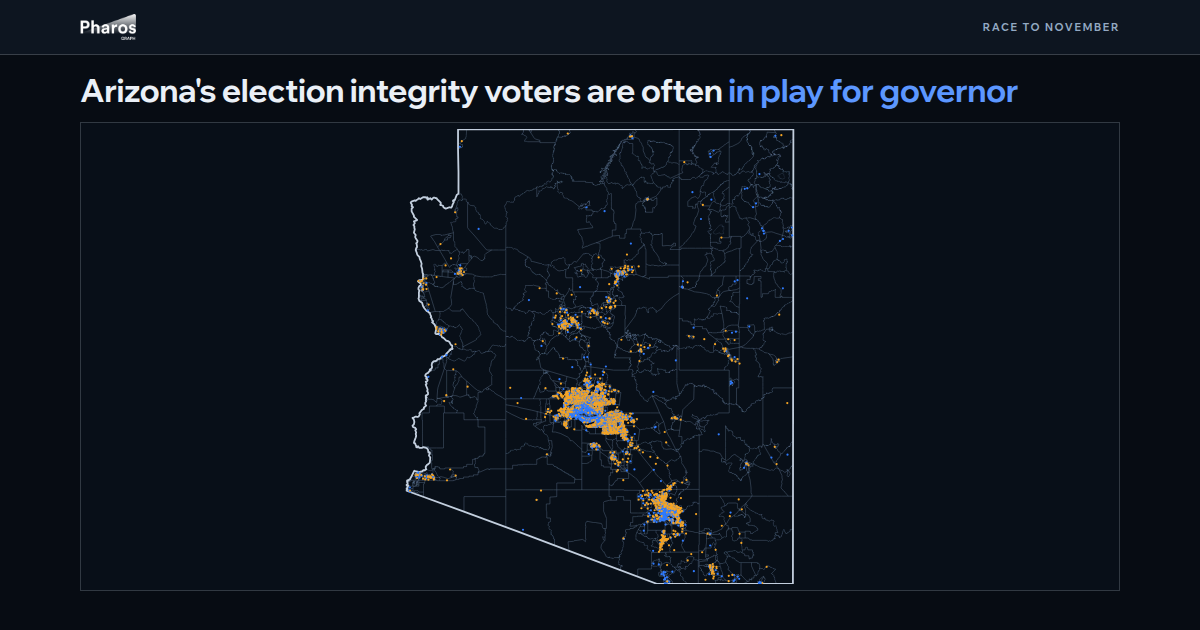
Audiences: PharosGraph Election Integrity Top 10 Percent and 10 to 20 Percent Salience, and the AZ Governor 2026 Persuade audiences, available through L2 in LiveRamp and L2 DataMapping.
The same scoring exists for every voter in every state. Data is from the week of September 15.
Check out the interactive map which shows all 698,653, and which of them are in play: https://maps.pharosgraph.com/az-election-integrity/
Maine Senate
Monday, September 28th
Over the last month, Social Security and Medicare climbed from a mid-tier issue to one of the top three shaping Maine’s Senate race, and it’s still gaining ground.
The Mainers who are most tuned into the issue have healthcare on their minds too. For most of them, healthcare bills are the household expense that worries them most. And many haven’t picked a side between Susan Collins and Troy Jackson, with the first debate coming October 6.
The interactive map (linked below) shows where these voters live. These PharosGraph audiences, and hundreds more, are available for activation through L2 DataMapping and LiveRamp.
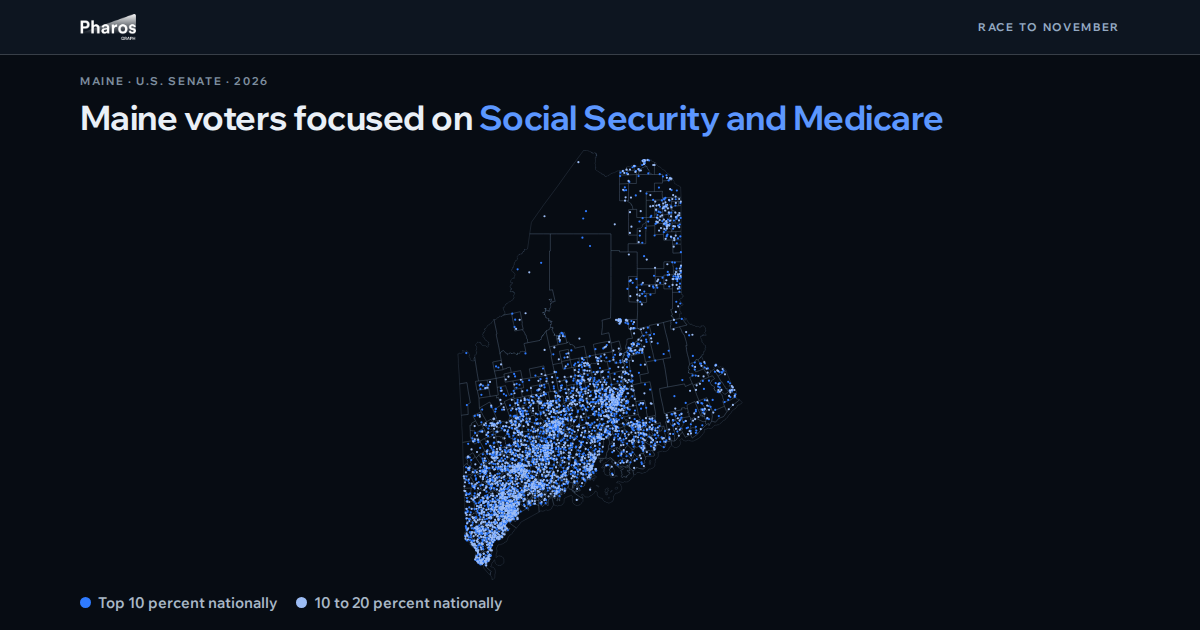
Audiences on the map: PharosGraph Social Security and Medicare Top 10 Percent and 10 to 20 Percent Salience. Behind the post: Cost of Living Driven by Healthcare Costs and the Maine Senate persuadable audiences. All available through L2 DataMapping and LiveRamp
The same scoring exists for every voter in every state. Data is from the week of September 15.
Check out the interactive map: https://maps.pharosgraph.com/me-social-security-medicare/
Arizona 6th Congressional District
Wednesday, September 9th
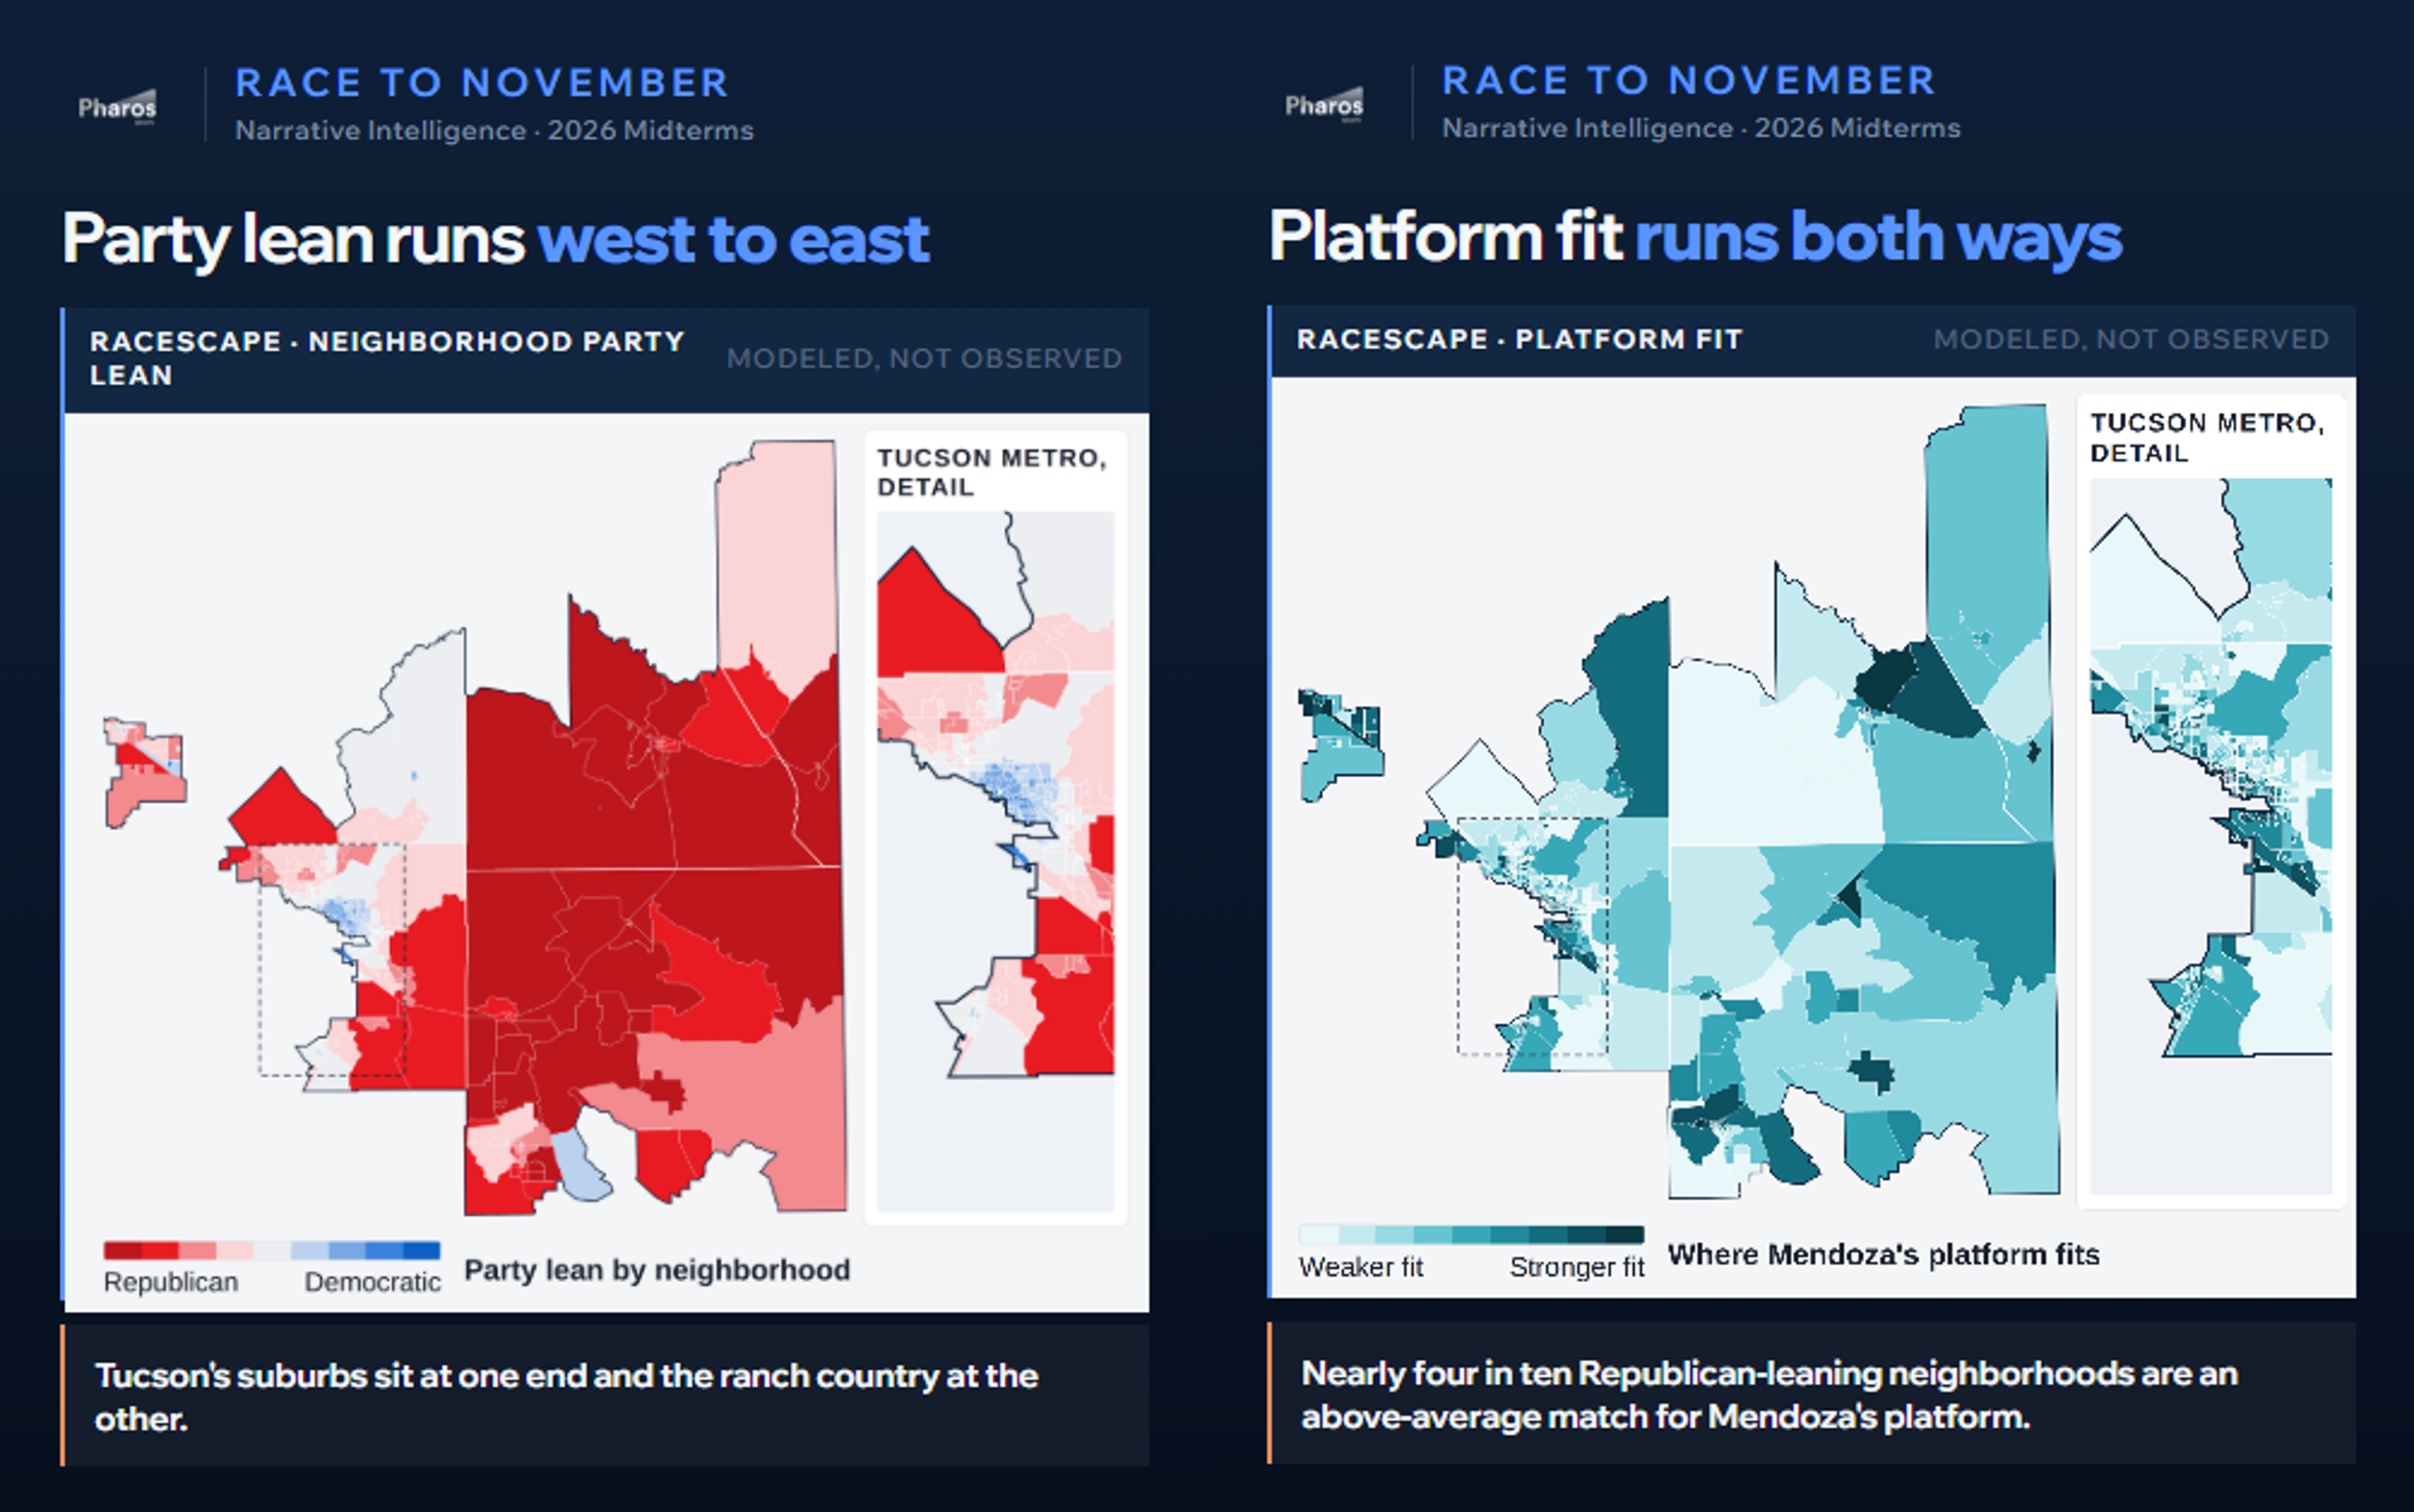
In Arizona’s 6th congressional district, a number of neighborhoods where JoAnna Mendoza’s 🔵 platform fits voters best are Republican-leaning. Meanwhile, neigborhoods where Juan Ciscomani’s 🔴 platform fits best sometimes lean Democratic. The party map reveals no surprises running clean from the Democratic Tucson suburbs in the west to Republican ranch country in the east.
In PharosGraph’s Race to November coverage, we found that each AZ-06 candidate’s platform fit is decided neighborhood by neighborhood. In fact, nearly four in ten Republican-leaning neighborhoods are an above-average match for Mendoza’s platform, and close to the same share of Democratic-leaning neighborhoods are an above-average match for Ciscomani’s. Two neighborhoods in the same town, with the same party lean, can sit at opposite ends of it.
The candidates debate on Thursday in a closely watched race, and each has more ground to work than the party map suggests.
Check out the interactive map: https://maps.pharosgraph.com/race-to-november-az-06/