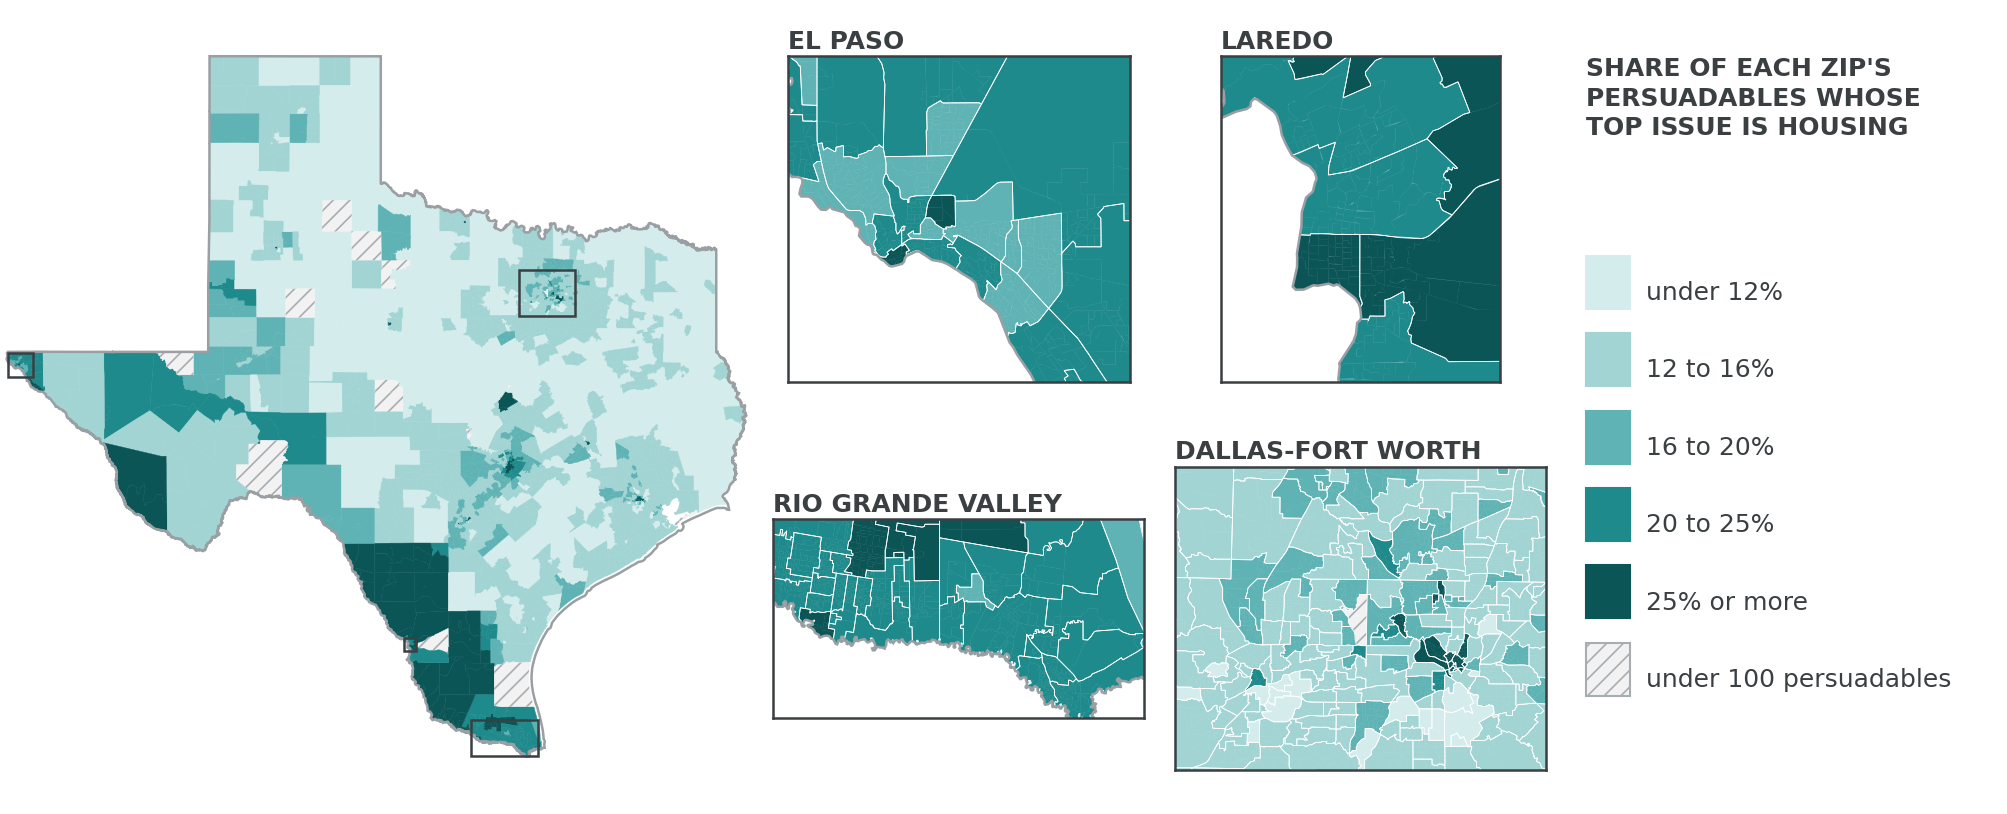
In the three border television markets (Harlingen, El Paso and Laredo), housing ranks first for 22% of persuadables, against 15% in the four big metro markets (Dallas-Fort Worth, Houston, San Antonio and Austin). Housing is distinctive on the border rather than dominant: it is third in Harlingen and El Paso, behind jobs and the safety net, and second in Laredo, behind jobs. In Laredo, jobs is first for 28% of persuadables and housing for 26%.
What this means for a plan built now
1. Plan the border for three messages, with housing among the three: third in Harlingen and El Paso, second in Laredo. Housing sits 3.5 points behind jobs, the leading issue, in Harlingen and 5.1 points behind in El Paso. In each border market the top three issues are first for 69% to 77% of persuadables, against 57% to 61% in Dallas-Fort Worth, Houston, San Antonio and Austin.
2. Lead Laredo with jobs and housing, its top two issues.
3. Give the housing line its own border budget, on the border markets’ broadcast and on what can be reached by ZIP: digital, streaming, mail and field. Of the $85.1 million placed on the race and first airing June 1 to September 16, about three quarters was placed in the four big metro markets.
The evidence
On the border the top three issues run close. In Harlingen, jobs is first for 27% of persuadables, the safety net for 25% and housing for 23%. In El Paso the same three are 25%, 24% and 20%.
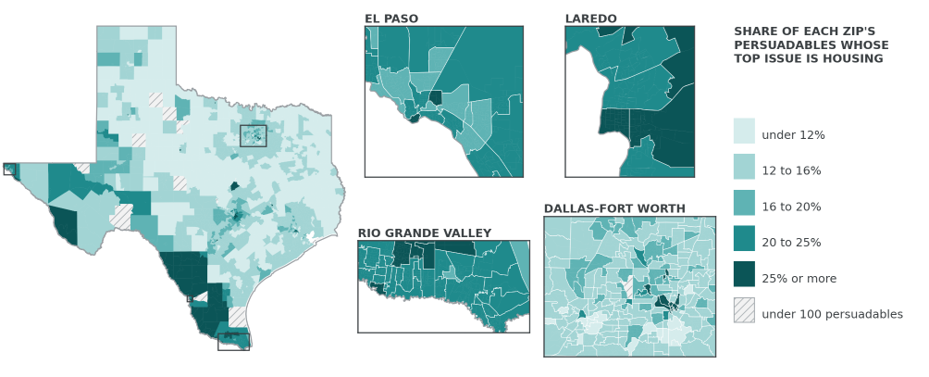
Texas, September 2026. Each shape is one ZIP, shaded by the share of its persuadable voters for whom housing ranks first; ZIP shares spread wider than the market figures above. Housing ranks first for 20% or more of persuadables in 174 ZIPs, and two thirds of the persuadables in them are in the three border markets. Hatched areas hold fewer than a hundred persuadables and are not scored. 249 scored ZIPs, about 1% of persuadables, have no boundary on file and are counted but not drawn. Nothing here describes an individual voter
What this is. The Persuadable Gap is a read on the voters campaigns are actually chasing, from Causal and PharosGraph. It is a diagnostic, not a forecast. We never say who will win. We say what a plan is built for, and where the ground it is built on varies.
How it is built. Covering 16,816,891 voters on the file. Persuadable is PharosGraph’s own definition, taken on our measure of how voters lean across issues: 30% of the file. Issue salience is modeled per voter against a national distribution and aggregated to ZIP from census tracts, so a few boundary ZIPs may be slightly off. The issues come from a fixed pool of eight: jobs, the safety net, housing, Social Security, government spending, K-12 education, health care and taxes. From this edition, each edition uses every issue in the pool where party explains no more than 22% of the variation in that state, measured on voters who cast only one party’s primary ballots from 2016 to 2024; the shares here are on all persuadables. In Texas that is six. Taxes and health care were left out: party explains 29.5% and 48.5% of them. Issue sets differ by state, so shares are not comparable across editions. Party explains less than 0.1% of housing, the least in the pool. Ad spend is every placement on the race by television market, from committees and outside groups alike, first airing June 1 to September 16, 2026, from AdImpact, reflecting what was bought rather than delivered. These are estimates, not survey responses, reported only in aggregate; ZIPs with fewer than a hundred persuadables are not scored. Voter data as of September 4, 2026.