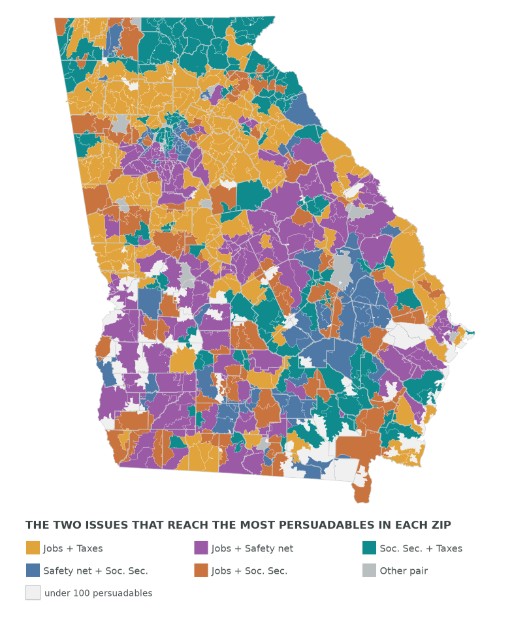
Georgia’s race for governor has 2,131,437 persuadable voters, and no single issue holds even a quarter of them. That makes a ZIP a two-message unit, and the question is which two.
They are the people both sides still have a reason to talk to: the middle band of each party’s file, ranked inside its own party, so the group is not simply a bunch of independents. We estimate which issue matters most to each of them, and the answer splits five ways. Jobs leads for 24%, taxes for 22%, poverty and the safety net for 21%, Social Security and Medicare for 19%, housing costs for 14%.
Start with what does not move. Across Georgia’s 634 ZIPs holding a hundred or more persuadables, jobs sits between 18% and 30% in four ZIPs out of five. It is the most common first choice in the state and the leading issue in only one ZIP in five. Jobs is the floor: present almost everywhere, dominant almost nowhere. You can run it as a base layer across the state.
What moves is everything else. Taxes runs from 9% of a ZIP’s persuadables at the tenth percentile to 38% at the ninetieth, a four-fold spread. Poverty and the safety net runs 8% to 37%. Those two are what a ZIP buy is actually purchasing. Taxes leads 213 ZIPs, the safety net leads 154, and they are rarely in the same places. These are like shares of a pie: when choosing a slice, part of that trade-off is arithmetic, and what matters for planning is that the leader changes.
Jobs is what you say everywhere. The rest is what you vary.
Pair each ZIP’s leading issue with its runner-up and five combinations cover 612 of the 634 ZIPs and 97.1% of Georgia’s persuadables. Jobs and taxes across the north and north-west, 184 ZIPs. Jobs and the safety net through the middle and south, 153. Social Security and taxes, 122. Jobs and Social Security, 87. The safety net and Social Security across east central Georgia, 66. That is five creative pairs, not six hundred, and the map says which ZIP gets which.
How much does the pair reach? The leading issue alone speaks to 33% of a ZIP’s persuadables. Adding the second takes it to 57%, a third to 75%. The second message adds nearly three quarters as much again as the first, which is why the pair is the unit worth planning around. One issue sits outside this. Housing costs are the top issue for 286,767 persuadable Georgians but lead in only four ZIPs, at 12% in the median ZIP. That makes housing the clearest case for a supporting line rather than a headline.
The two issues that reach the most persuadables in each ZIP
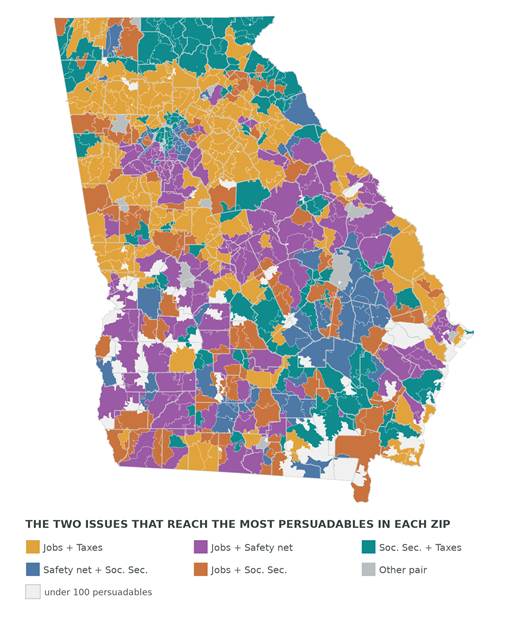
Georgia, September 2026. Each shape is one ZIP. The color is the pair of issues that together reach the most persuadable voters there, out of five issues scored for every voter on the file. Five pairs cover 612 of the 634 ZIPs shown and 97.1% of the state’s persuadables. Pale gray areas hold fewer than a hundred persuadables and are not scored. The shaded ZIPs cover 2,123,141 of Georgia’s 2,131,437 persuadables. Nothing here describes an individual voter.
What this is. The Persuadable Gap is a read on the voters campaigns are actually chasing, from Causal and PharosGraph. It is a diagnostic, not a forecast. We never say who will win. We say what a plan is built for, and where the ground it is built on varies.
How it is built. Covering 7,104,835 registered Georgians. Persuadable is PharosGraph’s own definition: every voter is ranked inside their own party bucket and the middle band of each is taken: 930,291 Democrats, 603,140 independents and 598,006 Republicans. That is 44%, 28% and 28% of the 2,131,437 shown, and 30% of the file. Georgia has no party registration, so the party buckets are modeled. Issue salience is modeled per voter and read against a national distribution, which is what makes five issues comparable, then aggregated to ZIP. ZIP figures are built from block groups rather than read from the file, so a few ZIPs on a boundary may be slightly off. The five shown are those where party explains no more than 22% of the variation across all 7.1 million Georgians, against about 28% for issue positions measured in national surveys (ANES 28.3%, CES 29.0%). These are estimates, not survey responses, and not anything a voter told anyone. Results are reported only in aggregate. ZIPs holding fewer than a hundred persuadables are not scored. Data as of September 4, 2026.
The Persuadable Gap · Causal and PharosGraph